- Essentials
- Getting Started
- Datadog
- Datadog Site
- DevSecOps
- Serverless for AWS Lambda
- Agent
- Integrations
- Containers
- Dashboards
- Monitors
- Logs
- APM Tracing
- Profiler
- Tags
- API
- Service Catalog
- Session Replay
- Continuous Testing
- Synthetic Monitoring
- Incident Management
- Database Monitoring
- Cloud Security Management
- Cloud SIEM
- Application Security Management
- Workflow Automation
- CI Visibility
- Test Visibility
- Intelligent Test Runner
- Learning Center
- Support
- Glossary
- Standard Attributes
- Guides
- Agent
- Integrations
- OpenTelemetry
- Developers
- Authorization
- DogStatsD
- Custom Checks
- Integrations
- Create an Agent-based Integration
- Create an API Integration
- Create a Log Pipeline
- Integration Assets Reference
- Build a Marketplace Offering
- Create a Tile
- Create an Integration Dashboard
- Create a Recommended Monitor
- Create a Cloud SIEM Detection Rule
- OAuth for Integrations
- Install Agent Integration Developer Tool
- Service Checks
- IDE Plugins
- Community
- Guides
- API
- Datadog Mobile App
- CoScreen
- Cloudcraft
- In The App
- Dashboards
- Notebooks
- Monitors and Alerting
- Infrastructure
- Metrics
- Watchdog
- Bits AI
- Service Catalog
- API Catalog
- Error Tracking
- Service Management
- Infrastructure
- Application Performance
- APM
- Continuous Profiler
- Database Monitoring
- Data Streams Monitoring
- Data Jobs Monitoring
- Digital Experience
- Real User Monitoring
- Product Analytics
- Synthetic Testing and Monitoring
- Continuous Testing
- Software Delivery
- CI Visibility
- CD Visibility
- Test Visibility
- Intelligent Test Runner
- Code Analysis
- Quality Gates
- DORA Metrics
- Security
- Security Overview
- Cloud SIEM
- Cloud Security Management
- Application Security Management
- AI Observability
- Log Management
- Observability Pipelines
- Log Management
- Administration
Log Analytics
Overview
Logs can be valuable as individual events, but sometimes valuable information lives in a subset of events.
In order to expose this information, you can group your logs into:
Switch between different aggregations of your queried logs with the logs query editor. The fields you select to group, aggregate, and measure your logs are saved as you switch between different visualizations and aggregation types.
You can add multiple queries to simultaneously analyze different sets of logs, and apply formulas and functions to your queries for in-depth analysis.
Aggregations are supported for indexed logs only. If you need to perform aggregation on non-indexed logs, consider temporarily disabling exclusion filters, generating log-based metrics, and/or running a rehydration on your archives.
Group logs by fields
When aggregating indexed logs by Fields, all logs matching your query filter are aggregated into groups based on the query search values.
On top of these aggregates, you can extract the following measures:
- count of logs per group
- count of unique coded values for a query search value per group (shown in the UI as
count unique of) - statistical operations (
min,max,avg, andpercentiles) on numerical values of a query search value per group
Individual logs with multiple query search values belong to that many aggregates. For instance, a log with the team:sre and the team:marketplace tags are counted once in the team:sre aggregate and once in the team:marketplace aggregate.
Visualize log groups
The Fields aggregation supports one dimension for the Top List visualization, and up to four dimensions for the Timeseries, Table, Tree Map, and Pie Chart visualizations.
When there are multiple dimensions, the top values are determined according to the first dimension, then according to the second dimension within the top values of the first dimension, then according to the third dimension within the top values of the second dimension.
Multiple queries
Multiple queries are supported in Timeseries and Table visualizations. Add multiple queries by clicking on the + Add button next to the query editor. When you add a new query, it is a copy of the last query and its grouping options:
Select or deselect queries to display in the current visualization by clicking on their letters in the query editor:
By default, when a new query is added, it is automatically selected to be displayed in the chosen visualization.
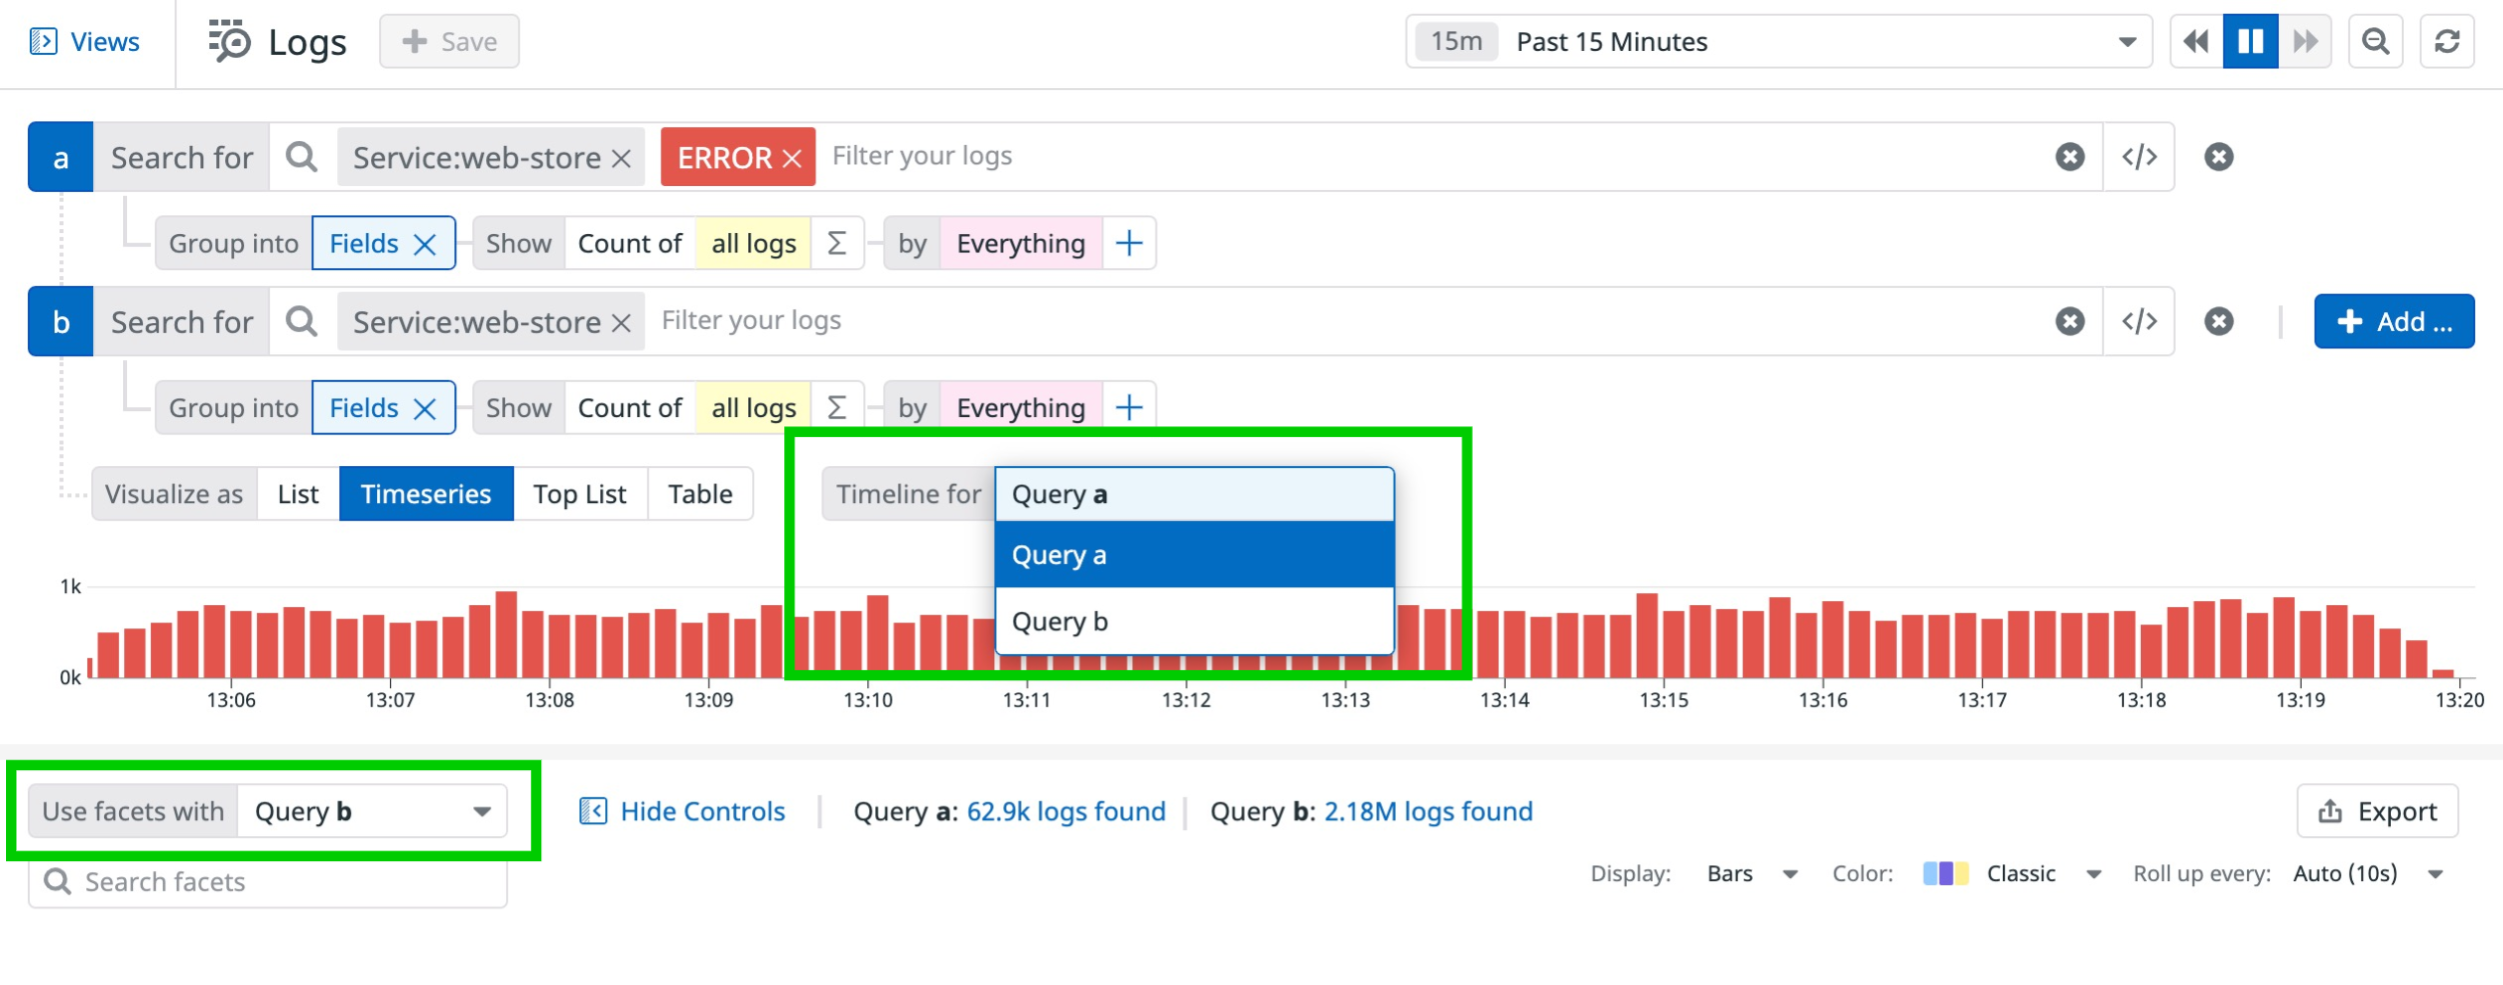
Display the timeline for one of your queries by selecting that query in the Timeline for dropdown. Scope one of your search queries by selecting that query in the Use facets with dropdown and clicking on values in the Facet Panel. Only the selected query is updated with the chosen facets.
Functions
Functions are supported in all visualizations.
Apply functions to your logs by clicking on the Fields aggregation in the query editor. Optionally select a faceted field to apply the function to, then click on the Σ icon next to that measure. Select or search for a function to apply to the selected log field.
All functions available for logs in the graphing editor in Dashboards can be applied to logs in the Log Explorer:
Here is an example of how to apply an Exclusion function to exclude certain values of your logs:
Formulas
Apply a formula on one or multiple queries by clicking on the + Add button next to the query editor. In the following example, the formula is used to calculate the ratio of the unique number of Cart Id in logs for Merchant Tier: Enterprise / Merchant Tier: Premium customers:
To apply formulas with multiple queries, all queries must be grouped by the same query search value. In the example above, both queries are grouped by Webstore Store Name.
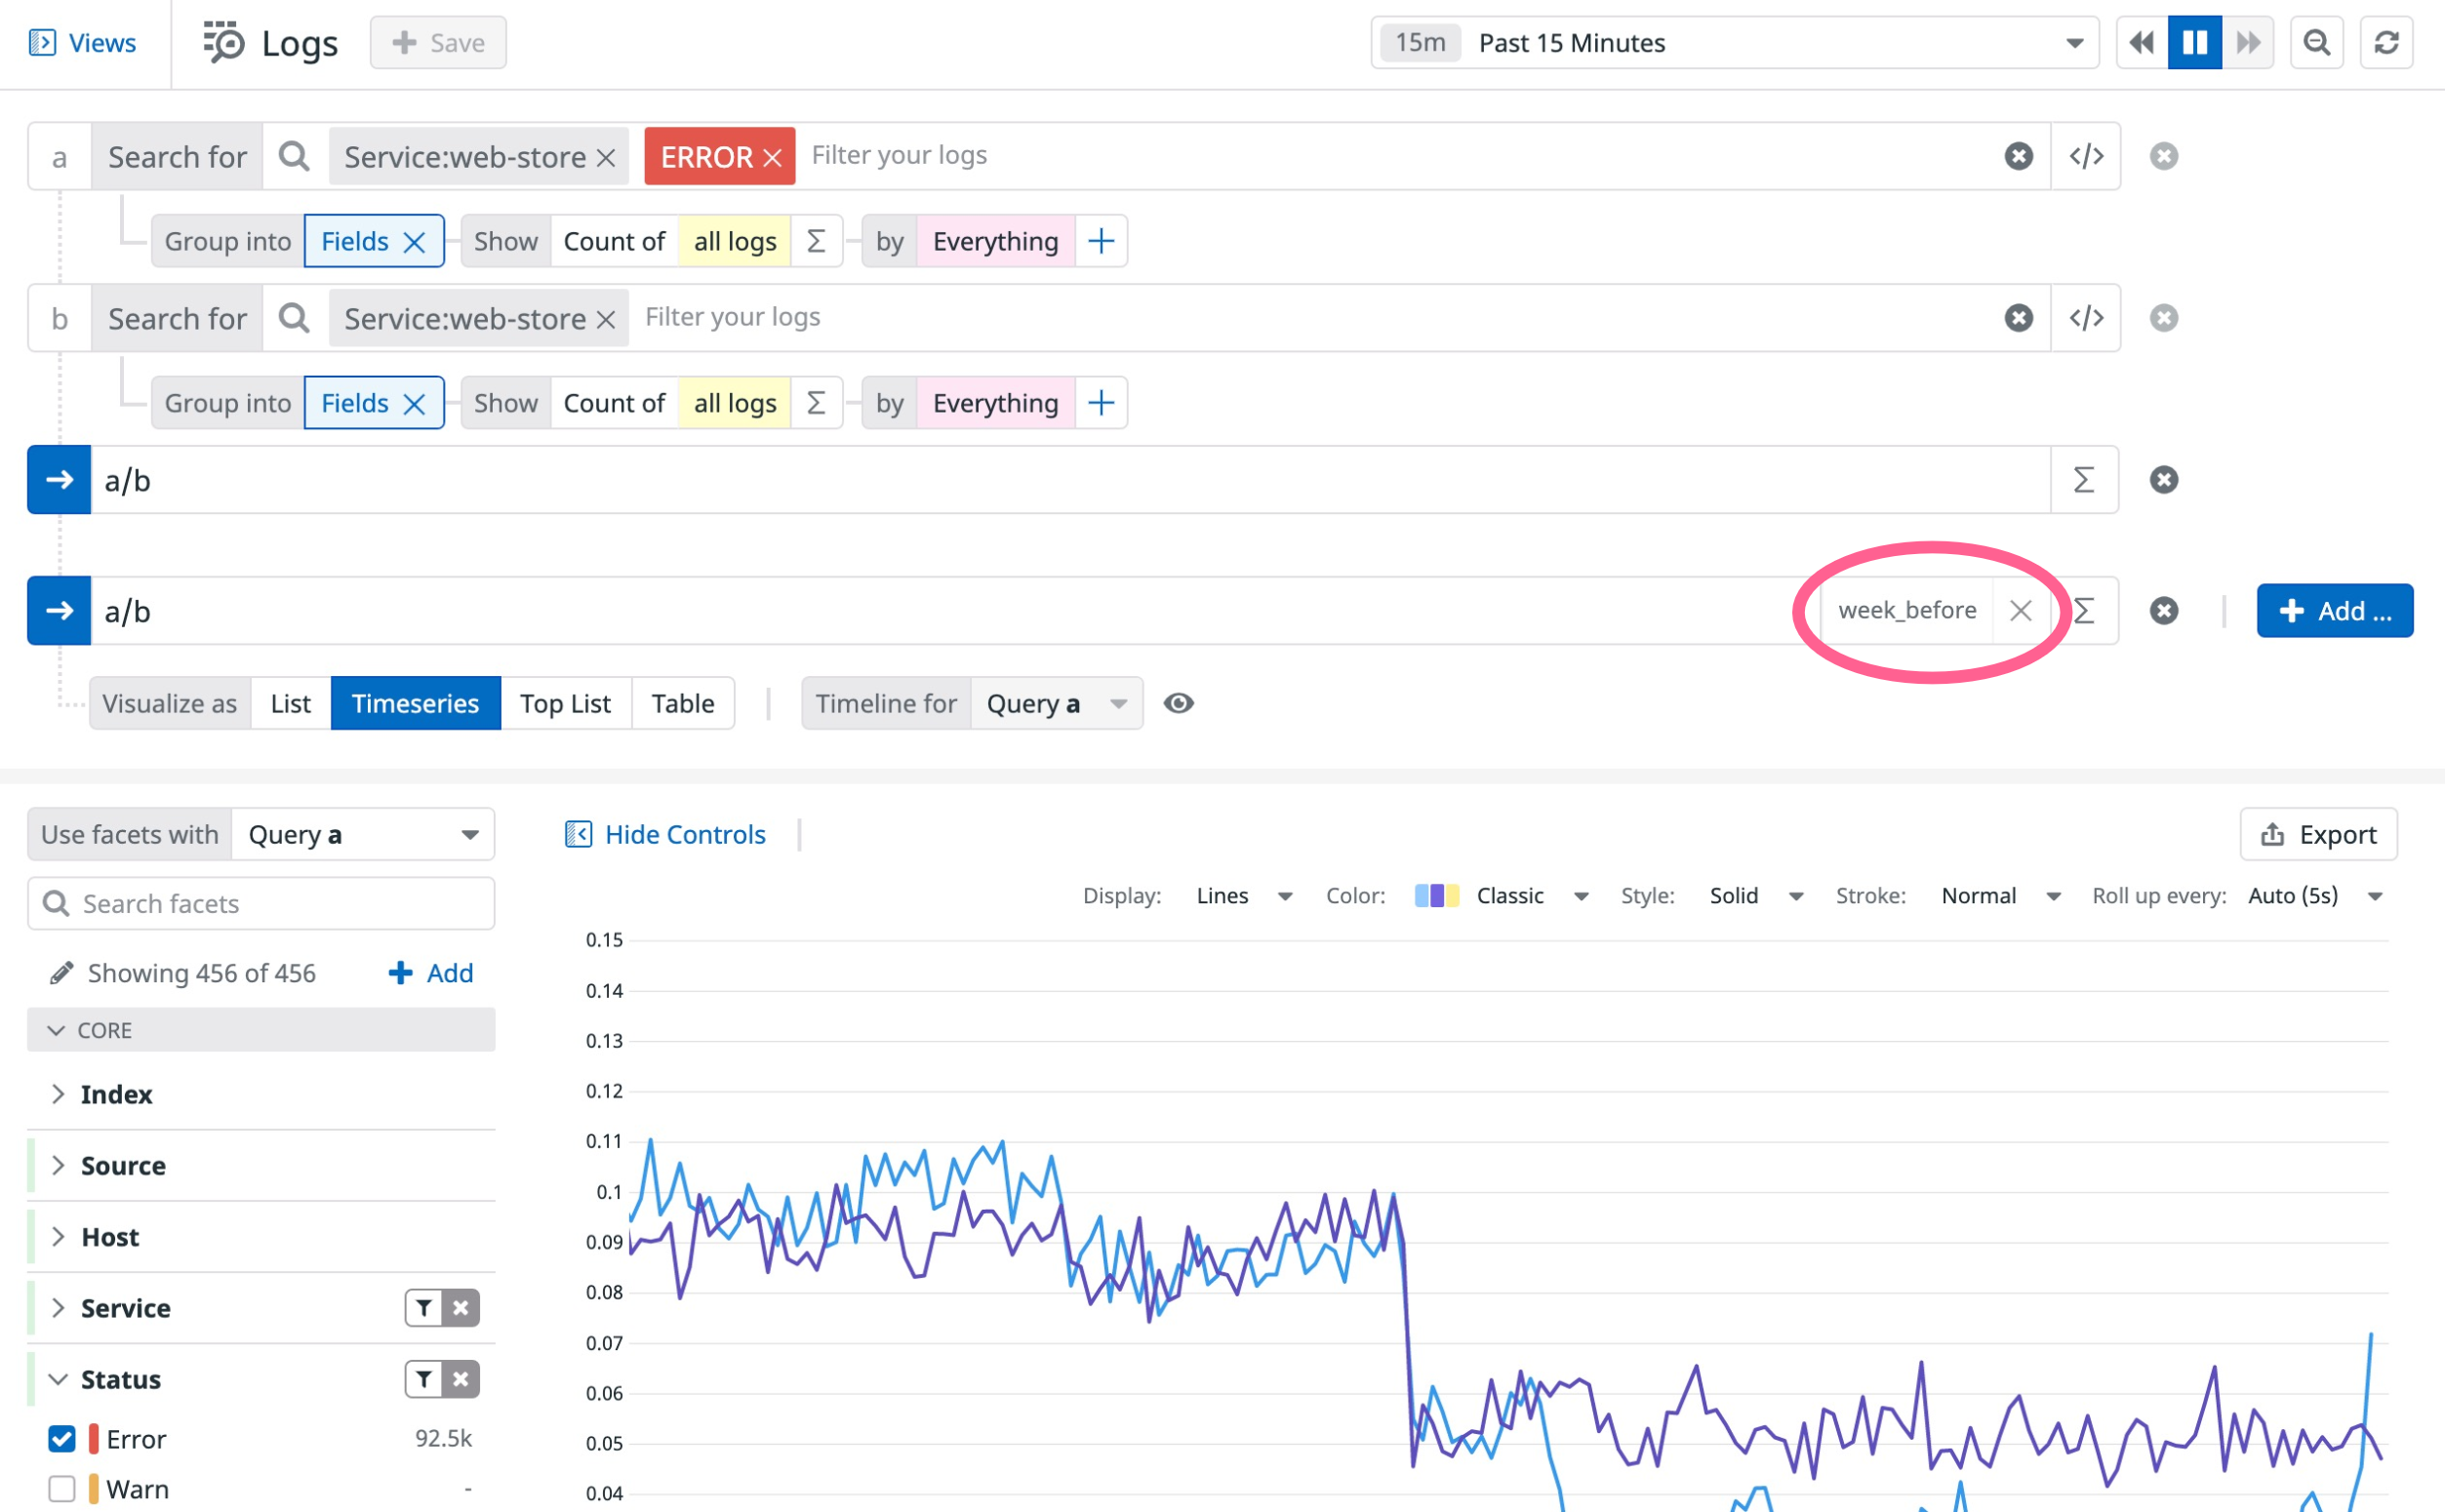
You can apply a function to a formula by clicking on the Σ icon. Here is an example of how to apply a Timeshift function on the proportion of error logs in all logs to compare current data with data from one week before:
Further reading
Additional helpful documentation, links, and articles:


