Google Ads Benchmarks 2024: New Trends & Insights for Key Industries
With over 80% of buying journeys beginning on search engines, it’s not a surprise that so many businesses are running search ads to capture searchers and convert them into customers.
But with search engines like Google constantly changing the search landscape, and with advertising costs rising across the board, it’s important to understand how your search ads are really performing to drive the best results for your business.
That’s where we come in! We analyzed over 17,000 campaigns running from April 2023 through March 2024 to create the latest version of our search advertising benchmarks report to give you a peek at how businesses in your industry are performing on Google Ads and Microsoft Ads.
We’re also providing expert insights and actionable tips to help you optimize your campaigns and get the best results from your search ads strategy.
🏃 Need to take this data to-go? We wrapped our 2024 Google Ads Benchmarks report into a free, easy-to-download guide here.
Contents
- Key trends: The big picture
- Microsoft and Google Ads benchmarks for every industry
- Average click-through rate
- Average cost per click
- Average conversion rate
- Average cost per lead
- What these search ad benchmarks mean for your business
In remembrance of Mark Irvine
Our team was deeply saddened to learn of Mark Irvine’s sudden passing in early May. Mark was a longtime friend and colleague as well as a frequent contributor to the WordStream blog, and the author of our first Google Ads benchmarks report in 2016. Our hearts go out to his friends and loved ones. Find our tribute to Mark here.
Microsoft and Google Ads benchmarks: Key trends in 2024
Before we get into the metric-by-metric details, let’s first get a birds’ eye view of the latest benchmark data.
Here are the overall trends for Google Ads and Microsoft Ads in 2024 you need to know:
- Click-through rate improved for most industries. 70% of industries saw an increase in CTR year over year, some significantly, with an overall average increase of 5% since 2023.
- Cost per click increased for 86% of industries. Some industries, like Real Estate, Sports & Recreation, and Personal Services saw increases of over 25% year over year, with an average overall increase of 10%.
- Conversion rate decreased for 12 out of 23 industries, although the average was fairly minimal at only 1%. Some industries did see bigger decreases, like Finance & Insurance (-32.40) and Dentists & Dental Services (-19.57%). But some industries saw substantial increases YoY, such as Apparel / Fashion & Jewelry (112.01%) and Career & Employment (80.97%).
- Cost per lead increased for 19 out of 23 industries, with an average increase of about 25%. This is a little lower than last year’s 27% increase, which came after record inflation and an unstable economy.
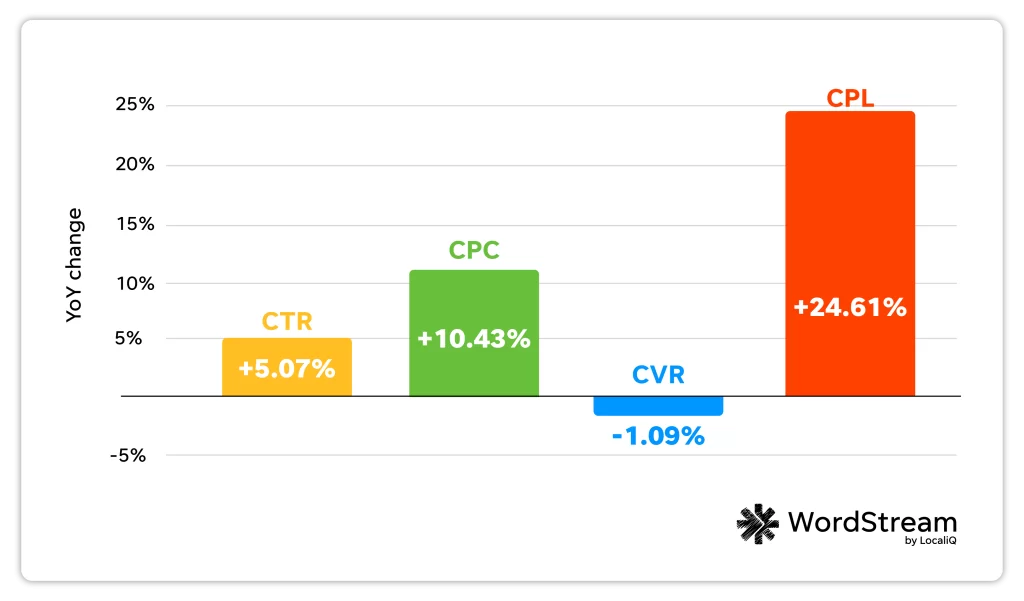
Year over Year Changes in Search Ads Metrics from 2023 to 2024
The overall takeaway from these trends? Increases in CTR indicate that the SERP is becoming more ad-friendly—for many queries, most results above the fold are ads, and ads continue to blend into organic results.
Google has also made broad match the default mode for match types, meaning ads may be matching to searches with relatively low commercial intent. This could lead to increases in clicks that don’t necessarily turn into sales.
The economy also continues to play a role in Google Ads costs increasing. In last year’s Google Ads benchmark report, CPC increased for about 60% of industries, but those increases were fairly small (averaging 2%). This year’s average is 10%, likely due to continued effects from inflation.
“The rise in CPC across most industries aligns with the ongoing economic challenges like inflation,” said Alessandro Colarossi, Partner Data Transformation Lead at Google.
It could also be due to Google increasing costs for their own bottom line. “Google only generates revenue when we click on ads… In 2023 those clicks generated $250B in revenue, up 5x over the last 10 years,” said Andy Crestodina, Co-Founder and CMO at Orbit Media, in this recent article.
🚨 Find out how your business compares to the industry average with our free Google Ads Grader!
Search ads benchmarks for every industry
Ready to dive deeper into some of the latest PPC trends? Here are the Microsoft Ads and Google Ads benchmarks across all metrics and industries for 2024.

Let’s take a closer look with a breakdown for each metric.
📧 Want the full data breakdown straight to your inbox? Download our free 2024 Google Ads benchmarks guide!
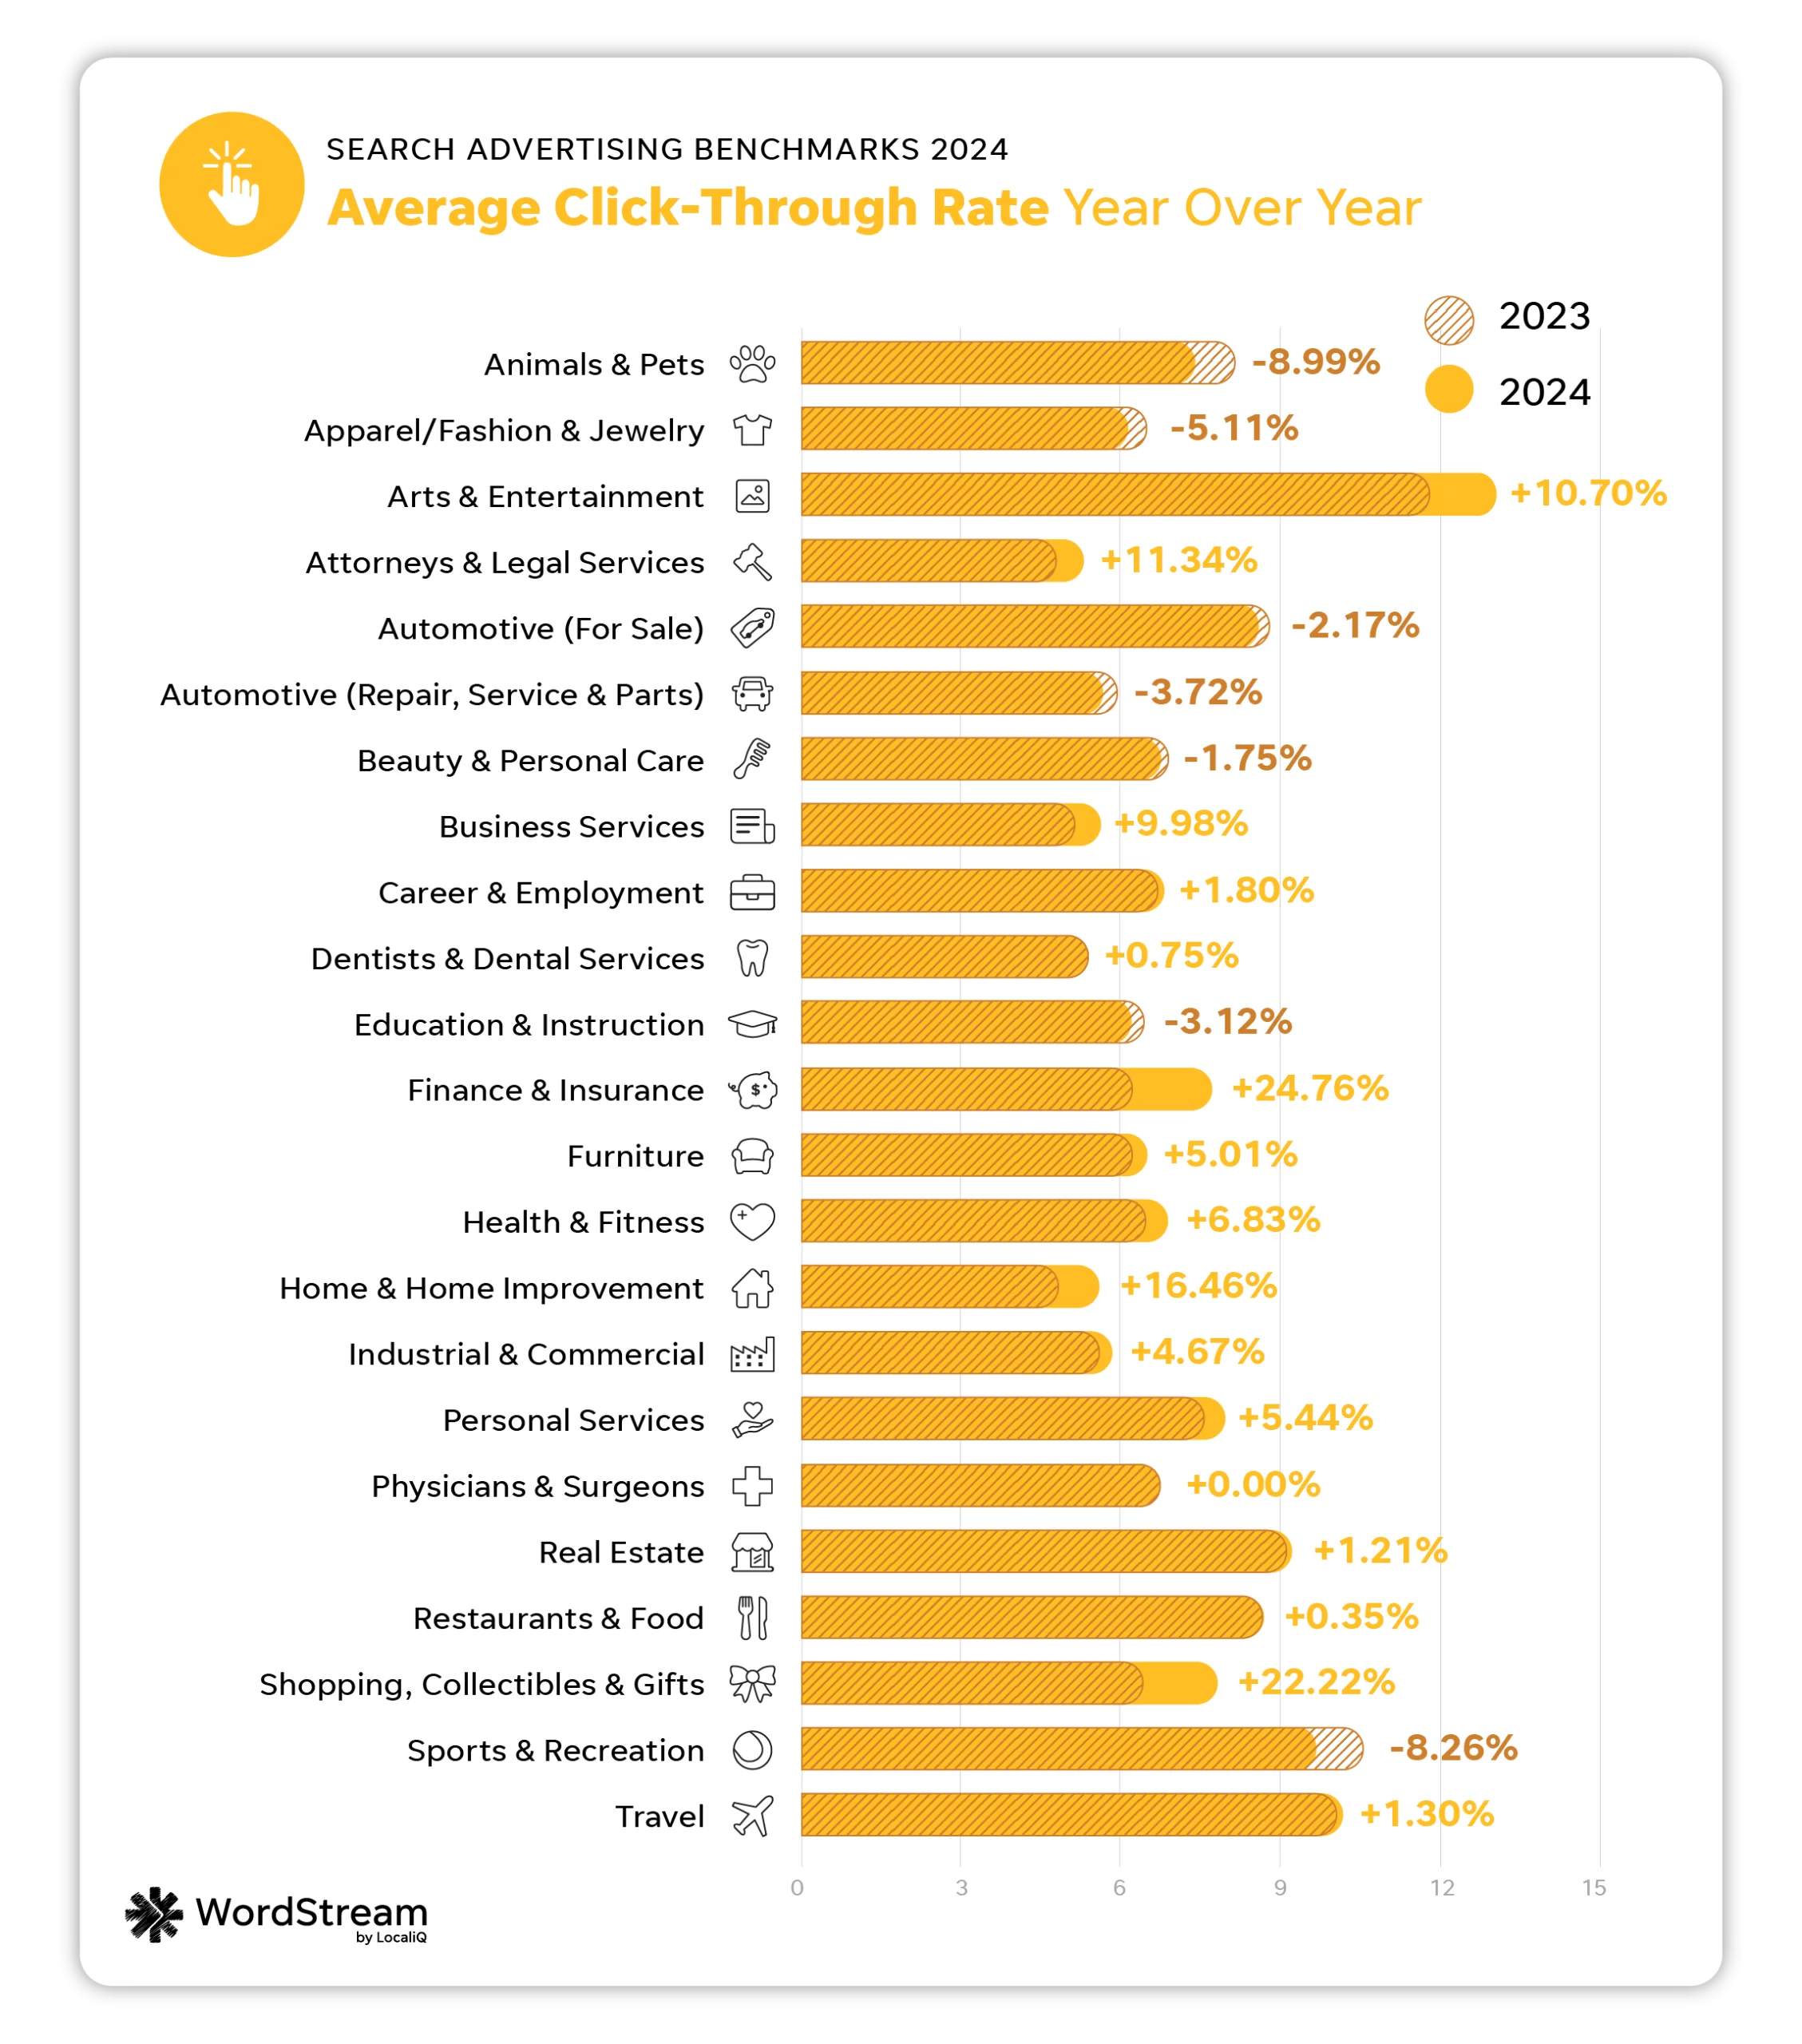
Average click-through rate in search ads
Click-through rate, while often overlooked in favor of cost-driven metrics, can be extremely telling when it comes to your search campaign performance. It indicates how frequently people are clicking on your ad once it’s shown in the SERP—which is half the battle when it comes to getting a conversion.
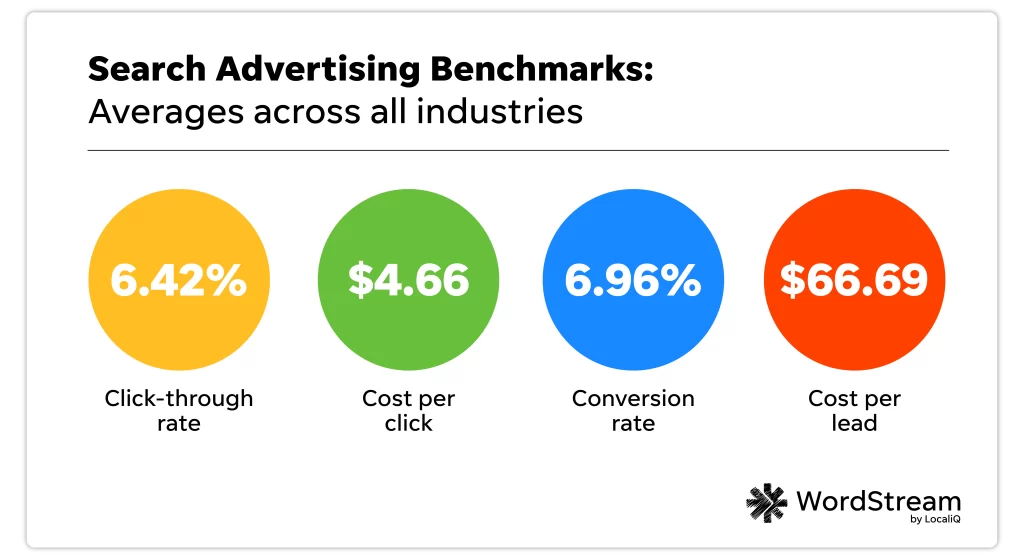
The average click-through rate in Google Ads in 2024 is 6.42%.
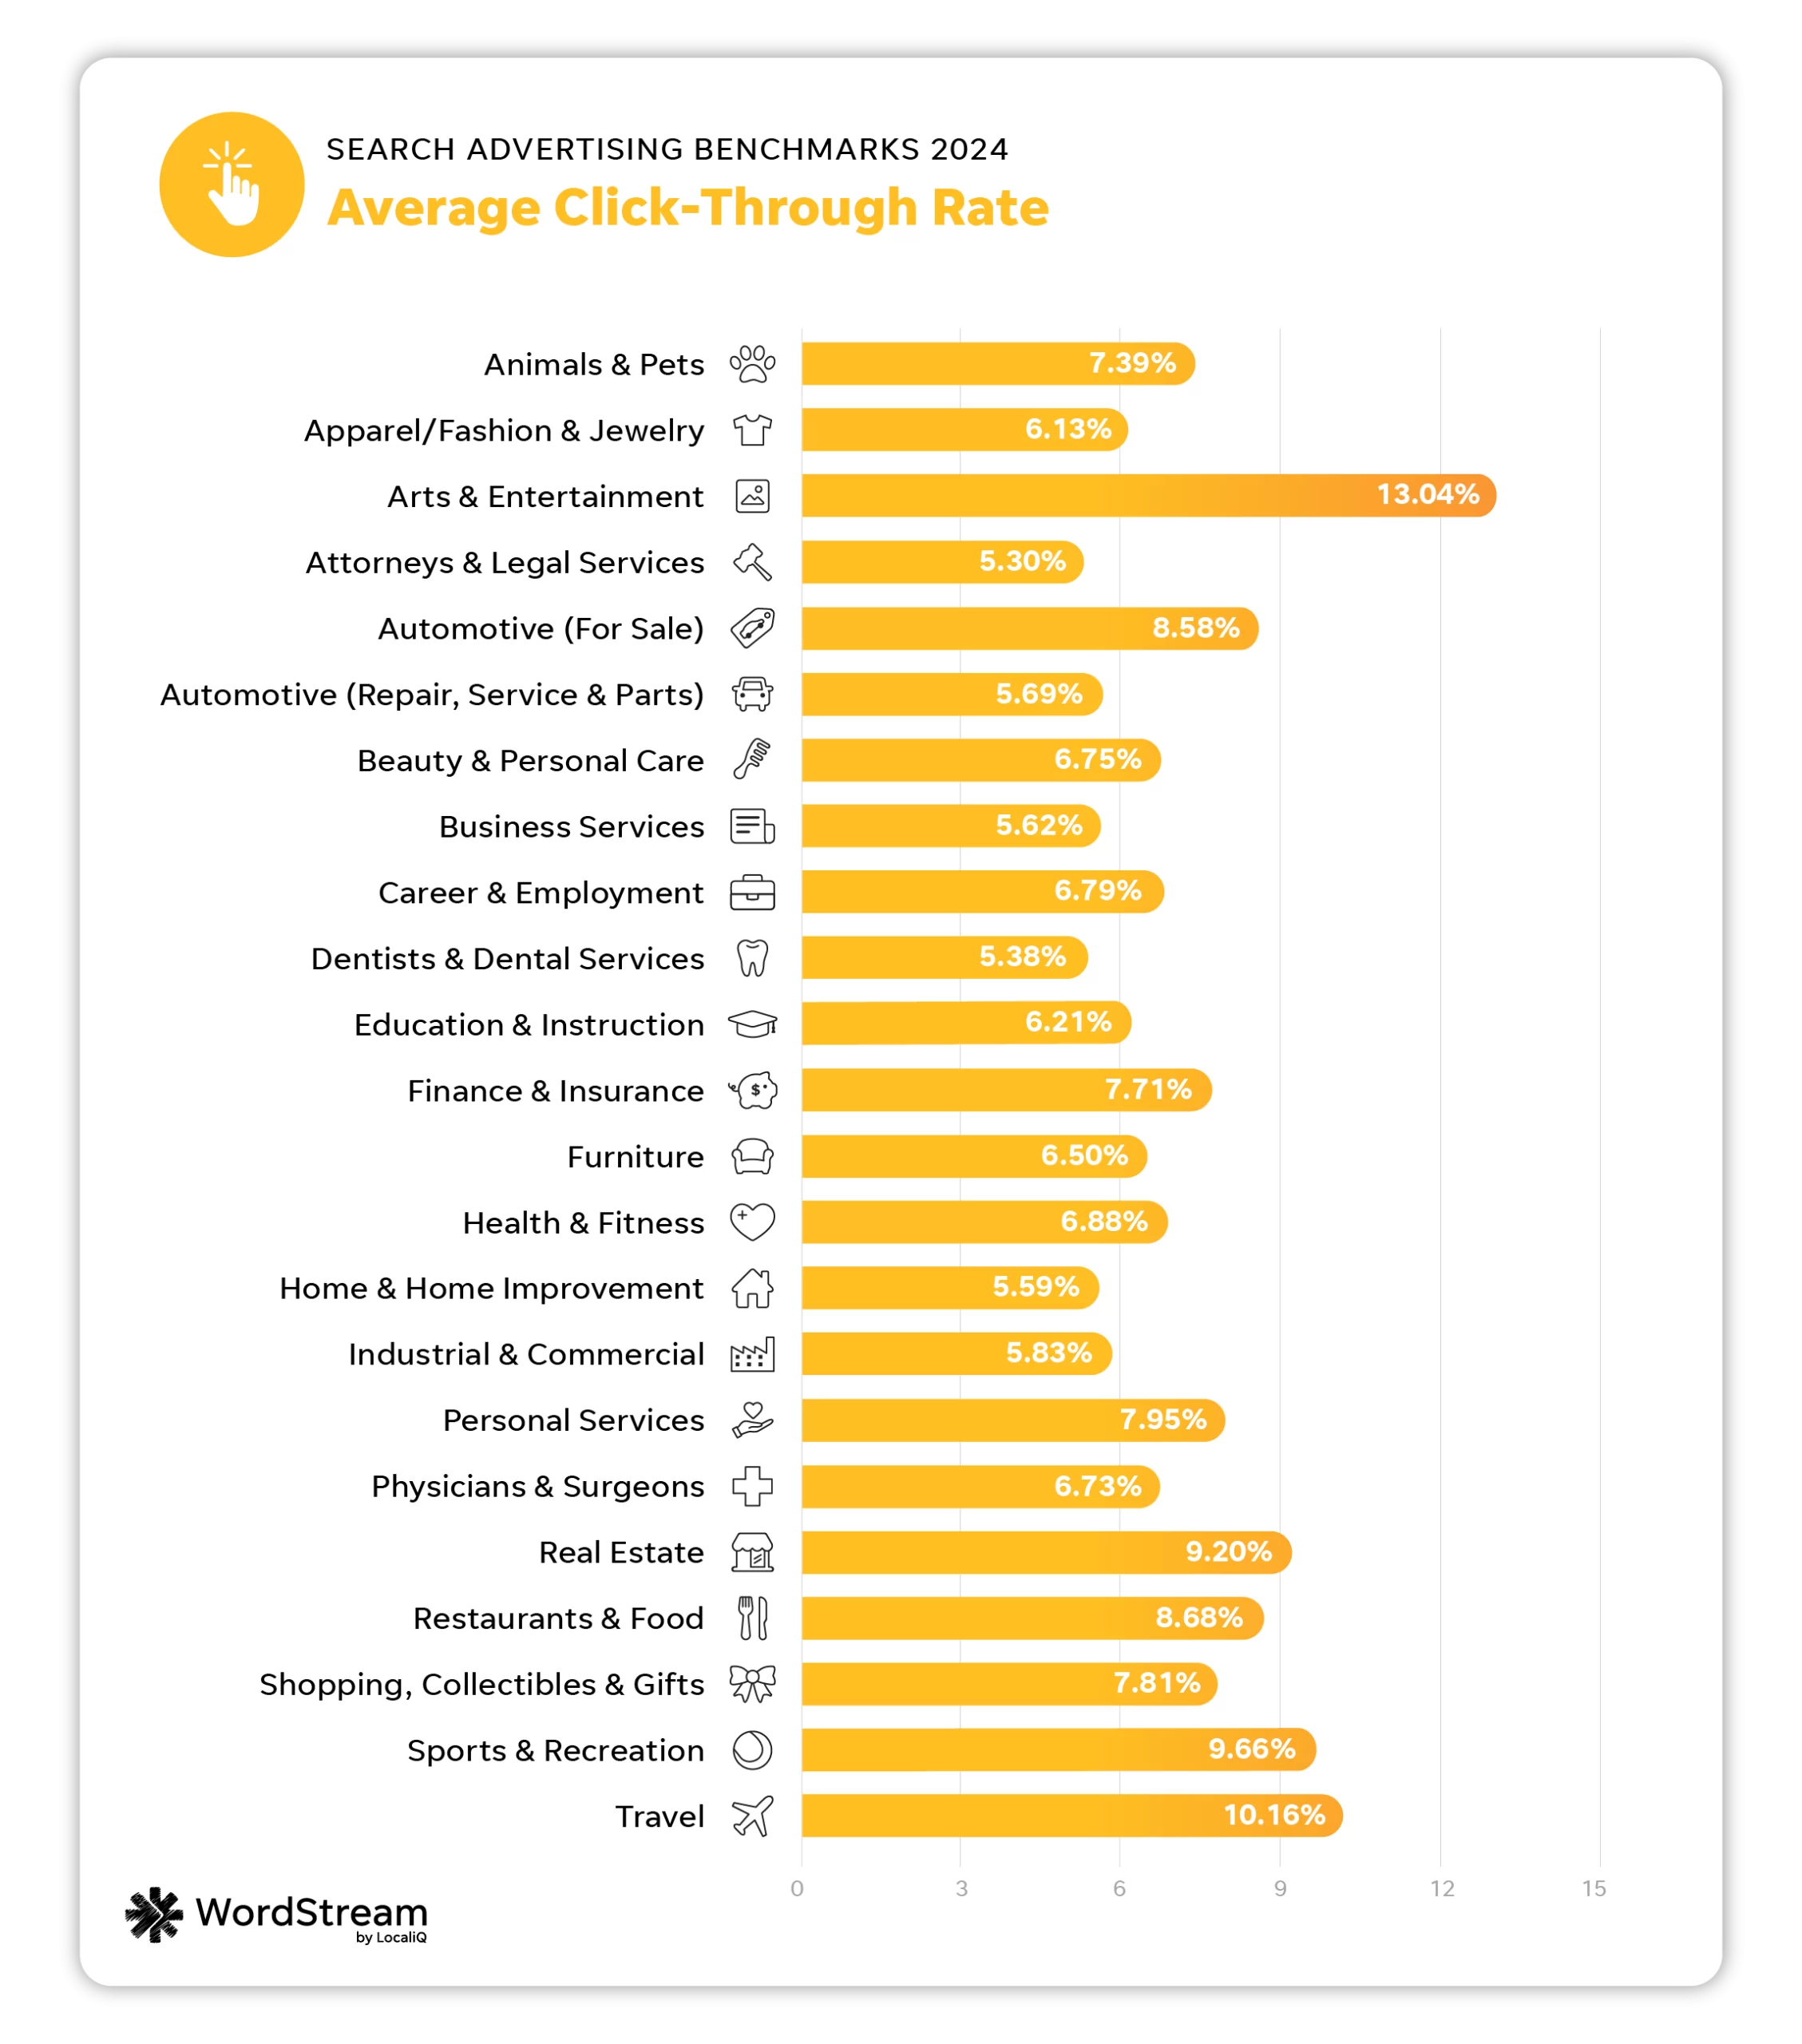
| Business category | Avg. CTR |
| Animals & Pets | 7.39% |
| Apparel / Fashion & Jewelry | 6.13% |
| Arts & Entertainment | 13.04% |
| Attorneys & Legal Services | 5.30% |
| Automotive — For Sale | 8.58% |
| Automotive — Repair, Service & Parts | 5.69% |
| Beauty & Personal Care | 6.75% |
| Business Services | 5.62% |
| Career & Employment | 6.79% |
| Dentists & Dental Services | 5.38% |
| Education & Instruction | 6.21% |
| Finance & Insurance | 7.71% |
| Furniture | 6.50% |
| Health & Fitness | 6.88% |
| Home & Home Improvement | 5.59% |
| Industrial & Commercial | 5.83% |
| Personal Services | 7.95% |
| Physicians & Surgeons | 6.73% |
| Real Estate | 9.20% |
| Restaurants & Food | 8.68% |
| Shopping, Collectibles & Gifts | 7.81% |
| Sports & Recreation | 9.66% |
| Travel | 10.16% |
The industries that saw the best average CTRs this year were Arts and Entertainment (13.04%), Sports and Recreation (9.66%), and Real Estate (9.20%).
Meanwhile, the industries with the lowest average CTRs were Attorneys and Legal Services (5.30%), Home and Home Improvement (5.59%) and Dentists and Dental Services (5.38%).
The overall increase in CTR for most industries indicates a more ad-friendly SERP, which has upsides and downsides. As results above the fold are increasingly populated by ads that blend seamlessly into organic results, advertisers will see an increase in clicks, but they may also see decreases in organic traffic.
“Since the advent of Responsive Search Ads, Google has been subtly shifting away from ads reading as a fixed three-headline format to something more flexible and agile for different screens. Now, you’re seeing ads with one headline that look nearly identical to their organic listings in every way,” said Mark Irvine, Vice President of Search at SearchLab.
Average click-through rate: YoY
The industries that saw the biggest increases in CTR performance year over year were Finance and Insurance (up 24.75%), Shopping, Collectibles, and Gifts (up 22.22%), and Home and Home Improvement (up 16.46%).
In contrast, the industries with the biggest decreases in CTR year over year were Animals and Pets (down 8.99%), Sports and Recreation (down 8.26%) and Apparel, Fashion, and Jewelry (down 5.11%).
The 2024 average CTR of 6.42% is higher than last year’s overall average of 6.11%.
How to improve click-through rate
If your current click-through rate doesn’t align with the average for your industry, you may want to consider how, exactly, your customers are searching for your business and tailor your ads accordingly.
“There are so many avenues now for consumers to find information that before you could only find on a website. You can be cooking dinner and just say ‘Alexa,’ or hit your watch and say ‘Hey, Siri.’ With so many ways for consumers to find search results, you are seeing the competition continue to increase,” said Stephanie Scanlan, Vice President of Client Success at LocaliQ.
Using keywords, headlines, and descriptions optimized for voice search, and answering customer pain points, questions, and more may make your ads more visible (and clickable) in the long run. You can find more ways to improve your click-through rate here.
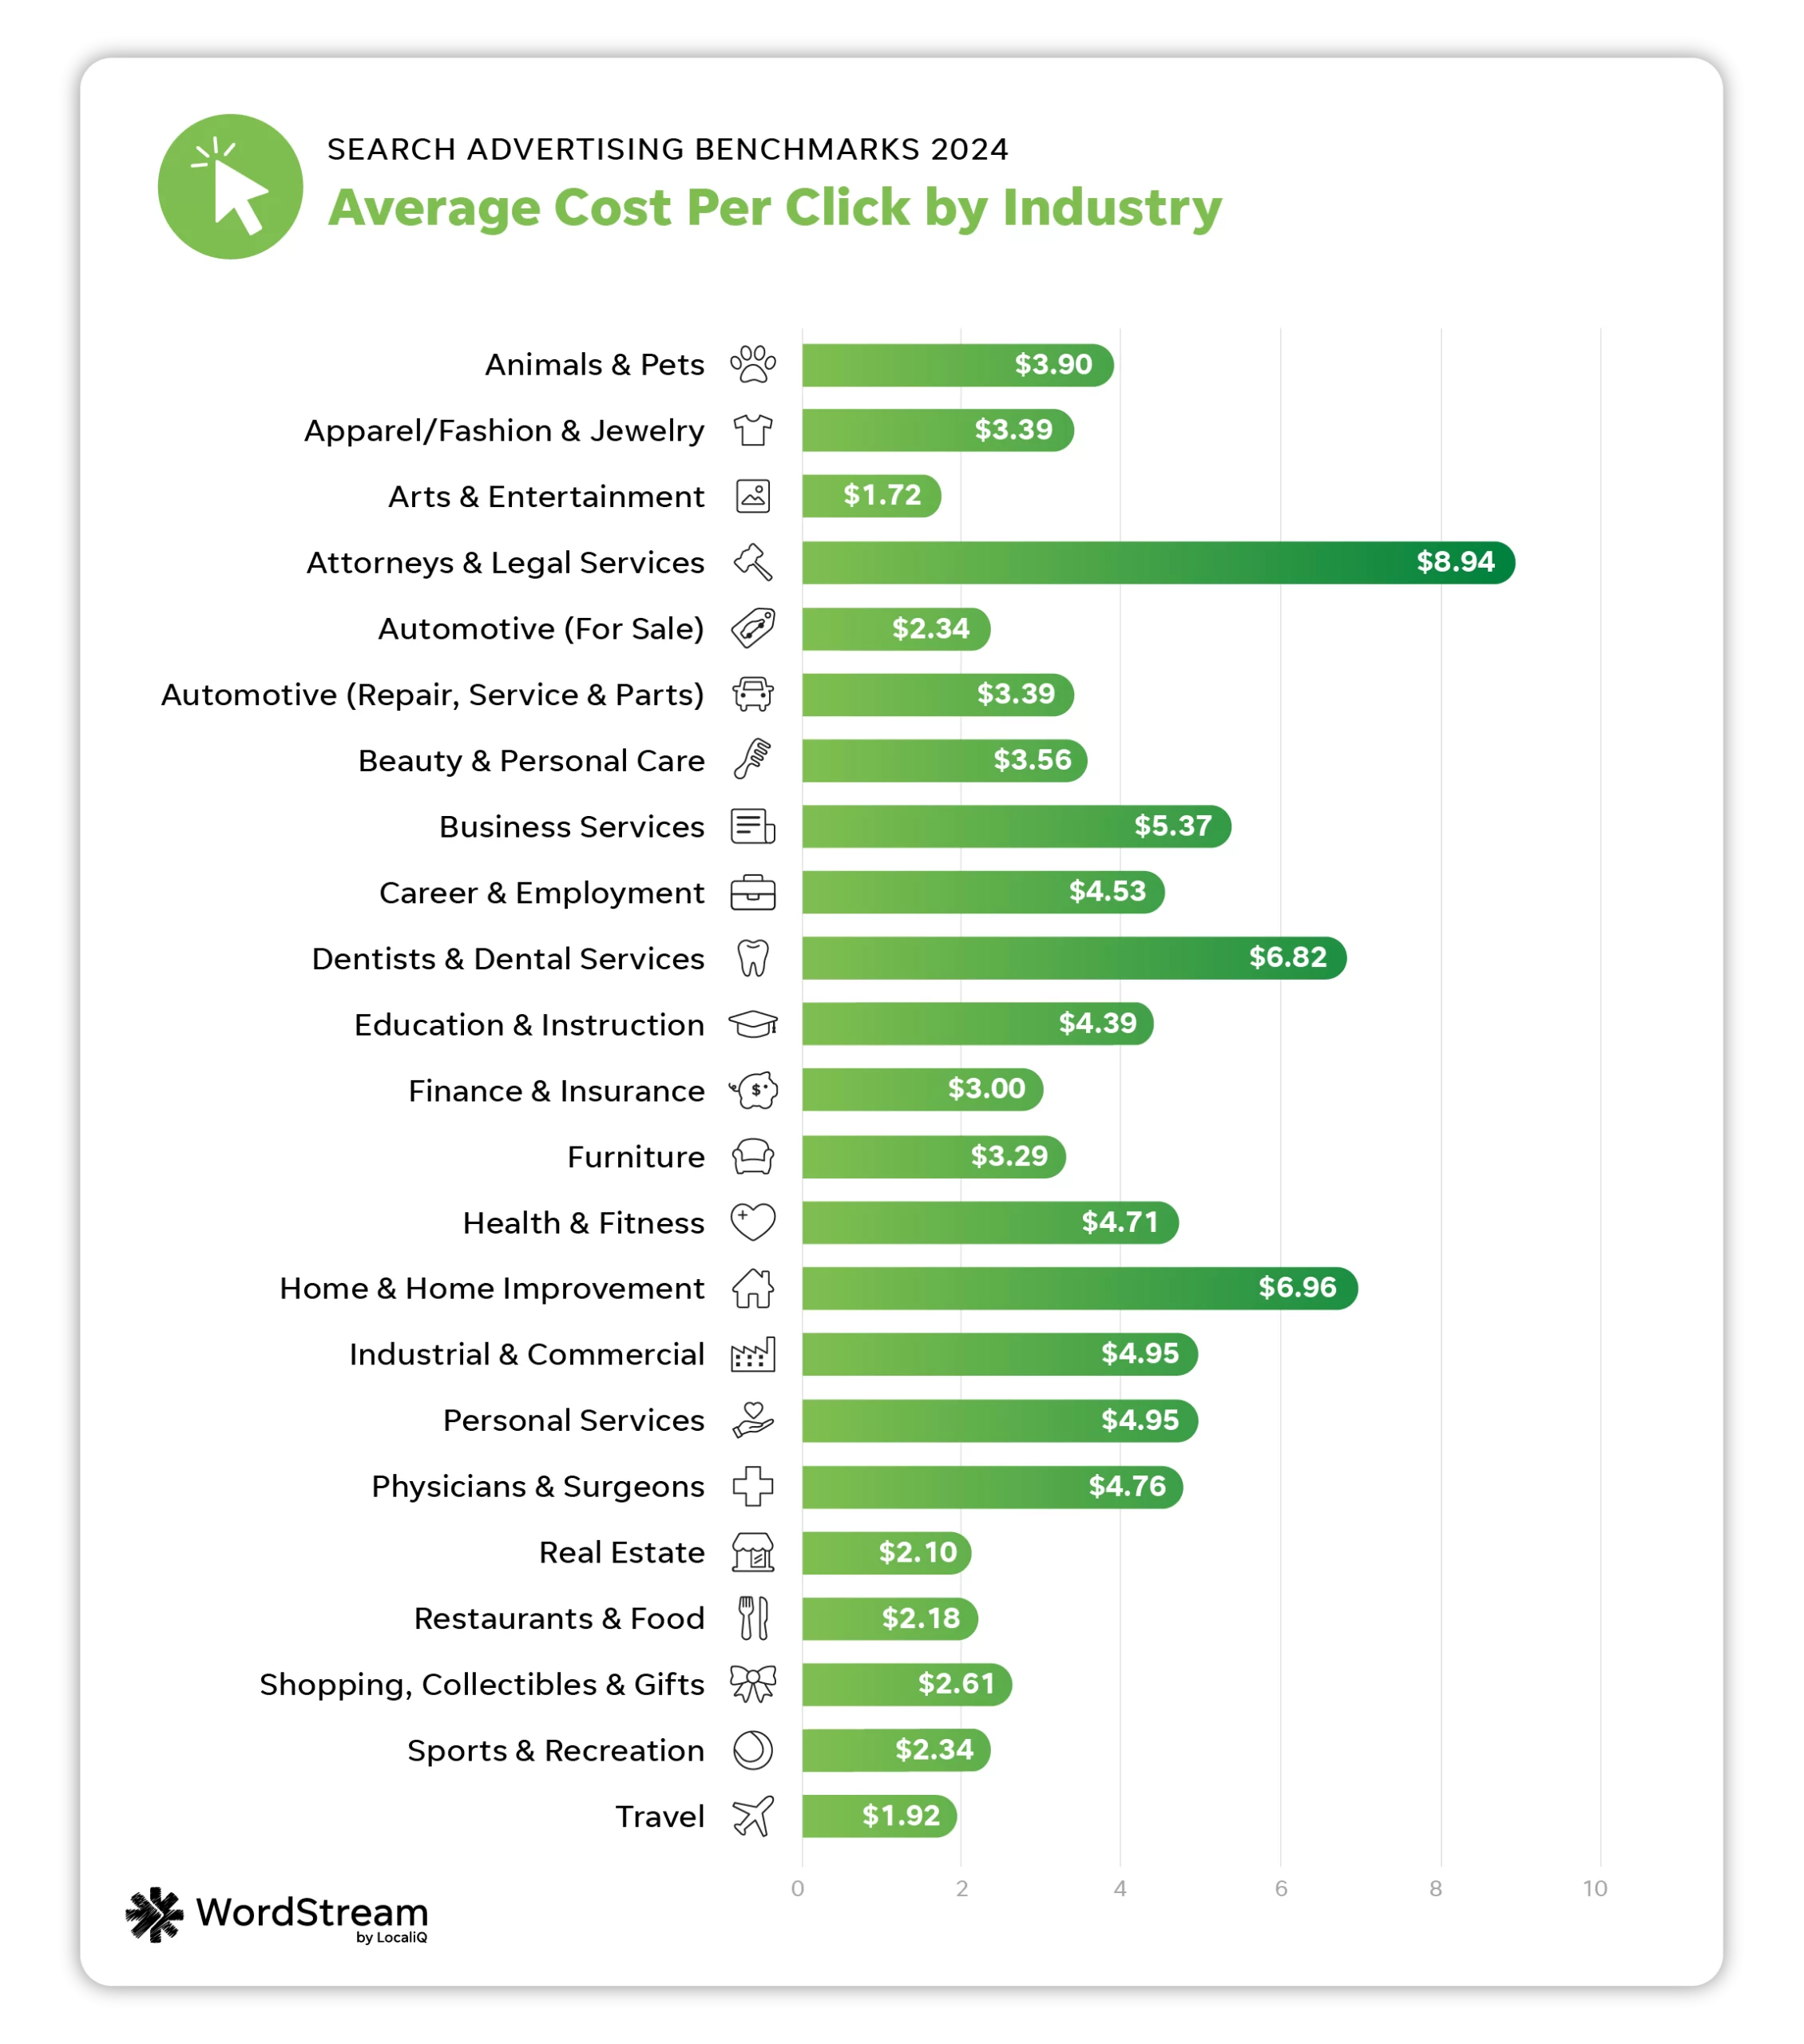
Average cost per click in search ads
You can’t take your click-through rate into consideration without also factoring in your cost per click. Cost per click is a measure of how much you’re charged, on average, for a click on your search ads. Cost per click can vary depending on your bidding strategy, click-through rates, industry competition, and more.
The average cost per click in Google Ads in 2024 is $4.66.
| Business category | Avg. CPC |
| Animals & Pets | $3.90 |
| Apparel / Fashion & Jewelry | $3.39 |
| Arts & Entertainment | $1.72 |
| Attorneys & Legal Services | $8.94 |
| Automotive — For Sale | $2.34 |
| Automotive — Repair, Service & Parts | $3.39 |
| Beauty & Personal Care | $3.56 |
| Business Services | $5.37 |
| Career & Employment | $4.53 |
| Dentists & Dental Services | $6.82 |
| Education & Instruction | $4.39 |
| Finance & Insurance | $3.00 |
| Furniture | $3.29 |
| Health & Fitness | $4.71 |
| Home & Home Improvement | $6.96 |
| Industrial & Commercial | $4.95 |
| Personal Services | $4.95 |
| Physicians & Surgeons | $4.76 |
| Real Estate | $2.10 |
| Restaurants & Food | $2.18 |
| Shopping, Collectibles & Gifts | $2.61 |
| Sports & Recreation | $2.34 |
| Travel | $1.92 |
This year’s industries with the lowest average CPCs were Arts and Entertainment at $1.72, Travel at $1.92, and Real Estate at $2.10.
The industries with the highest average CPCs were Attorneys and Legal Services ($8.94), Home and Home Improvement ($6.96), and Dentists and Dental Services ($6.82).
Last year, CPC increased for about 60% of industries, but those increases were fairly small (averaging 2%). This year’s average increase is 10%. This is likely due to continued effects of inflation; while rates on inflation have slowed, the costs of most goods and services have not come down.
While industries like Attorneys and Legal Services typically face higher costs, conversions from these pricier clicks can be of much higher value for these types of businesses.
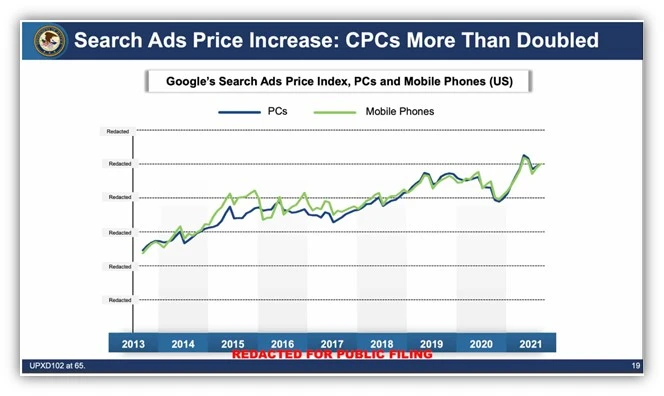
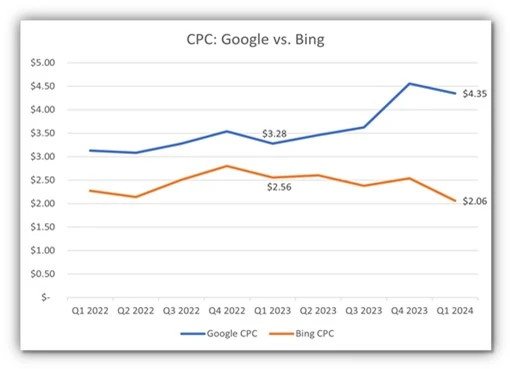
It isn’t a shock that some industries are seeing high costs per click, as it was found in the Google Antitrust trial that CPCs have steadily increased over the years.
Average cost per click: YoY
The industries with the biggest drops in CPC performance were Real Estate (increased 35.48%), Sports and Recreation (increased 32.20%), and Personal Services (increased 26.92%).
Meanwhile, the industries that saw the biggest improvements in CPC performance were Finance and Insurance (-25.19%), Attorneys and Legal Services (-2.93%), and Business Services (-1.83%).
This year’s overall average CPC of $4.66 is 44 cents higher than last year’s average of $4.22.

How to lower cost per click
When it comes to any cost in Google Ads, including cost per click, there are a few factors that may be out of your control.
“The noticeable jump in CPC prices could be due to the lingering effects of inflation. Like almost everything else—advertising costs have gone up for businesses, and that is largely contributing to the changes in CPC trends we’re seeing,” said Goran Mirkovic, CMO at Freemius.
“Changes in industry-specific demand (like real estate), competition levels, unique advertising tactics, and consumer behavior could also be impacting these trends. As users interact with search results and ads in new ways, it’s only natural to expect that these changes will have a visible impact in both CTR and CPC rates,” said Goran.
However, there are still optimizations you can make to lower your cost per click. For example, tightly aligning your landing pages with your keyword intent can increase your Quality Score, which in turn can lower your cost per click.
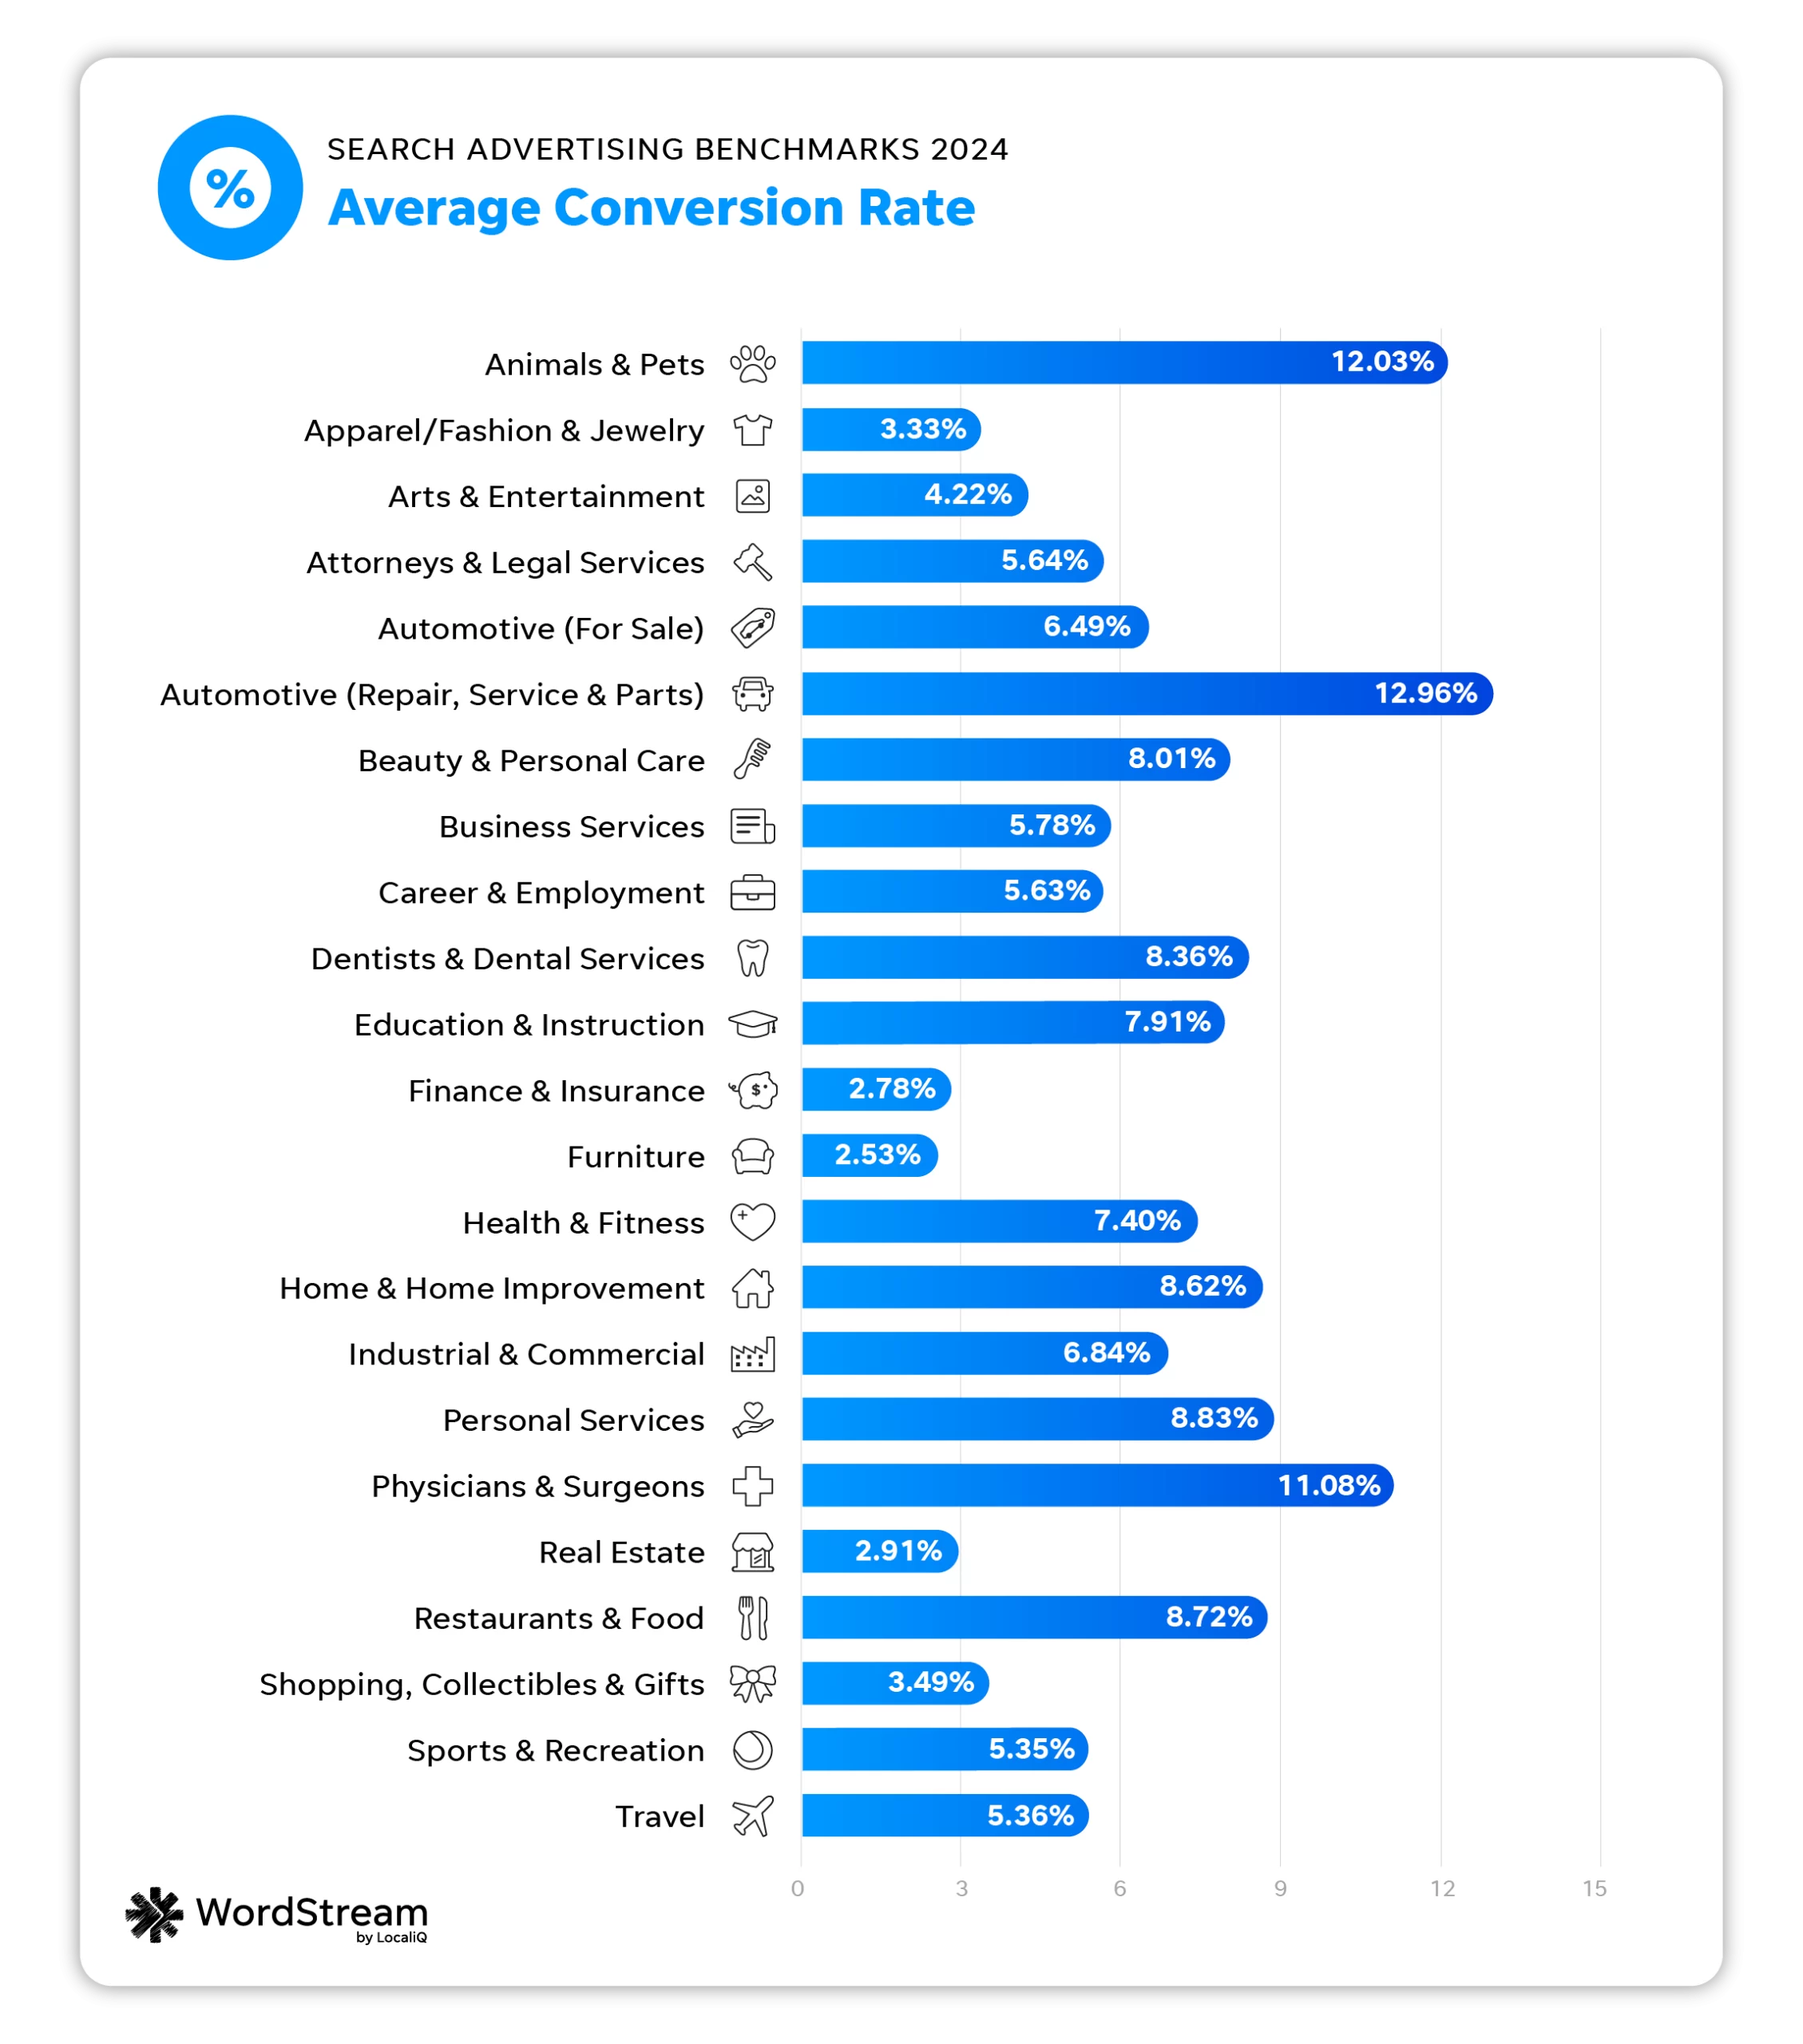
Average conversion rate in search ads
Conversion rate is one of the most important PPC metrics to advertisers because it accounts for how many ad clicks turn into real sales or leads.
It can be tricky to balance trying to achieve a high conversion rate while lowering costs. That’s why it’s so important to closely track your conversion rate against other metrics in your account to get a holistic view of your strategy.
The average conversion rate in Google Ads in 2024 is 6.96%.
| Business category | Avg. CVR |
| Animals & Pets | 12.03% |
| Apparel / Fashion & Jewelry | 3.33% |
| Arts & Entertainment | 4.22% |
| Attorneys & Legal Services | 5.64% |
| Automotive — For Sale | 6.49% |
| Automotive — Repair, Service & Parts | 12.96% |
| Beauty & Personal Care | 8.01% |
| Business Services | 5.78% |
| Career & Employment | 5.63% |
| Dentists & Dental Services | 8.36% |
| Education & Instruction | 7.91% |
| Finance & Insurance | 2.78% |
| Furniture | 2.53% |
| Health & Fitness | 7.40% |
| Home & Home Improvement | 8.62% |
| Industrial & Commercial | 6.84% |
| Personal Services | 8.83% |
| Physicians & Surgeons | 11.08% |
| Real Estate | 2.91% |
| Restaurants & Food | 8.72% |
| Shopping, Collectibles & Gifts | 3.49% |
| Sports & Recreation | 5.35% |
| Travel | 5.36% |
The industries that had the highest average CVRs were Automotive Repair, Service, and Parts at 12.96%, Animals and Pets at 12.03%, and Physicians and Surgeons at 11.08%.
Industries that saw the lowest average CVRs were Furniture at 2.53%, Finance and Insurance 2.78%, and Real Estate at 2.91%.
As ads are blending into organic results, and often take up more space on the SERP even for search terms with low commercial intent, lower CVRs may be more common. This is because of an increase in clicks from people who may not be ready to convert.
Advertisers have to be really savvy in making the most of their spend and focusing their budget on the highest-intent keywords to maintain strong conversion rates.
Average conversion rate: YoY
The industries with the biggest conversion rate decreases were Finance and Insurance (-32.40%), Dentists and Dental Services (-19.57%), and Attorneys and Legal Services (-19.46%.)
The industries with the highest conversion rate increases were Apparel, Fashion, and Jewelry (112%), Career and Employment (80.97%), and Restaurants and Food (72.16%).
The 2024 overall average conversion rate of 6.96% is only slightly lower than last year’s average of 7.04%.

How to improve conversion rates
When you’re trying to improve your conversion rate, it’s important to first find any correlations between your conversion rate performance and your progress in other PPC metrics.
“All of your different KPIs (key performance indicators) give you a guide to what optimizations need to be made to improve your PPC results,” said Stephanie.
“While cost per conversion, conversion rate, and cost per lead are the indicators to focus most heavily on, a poor CTR or higher-than-needed CPC can also give you insights into a potential problem with your campaign—impacting the overall results. Each KPI should be reviewed both independently and within the bigger picture of overall results to see if they can be optimized to better improve your overall ROI.”
For example, if you find you have a low conversion rate but high CPCs, you should first try to get more clicks at a lower cost, since clicks are half the battle when securing conversions. You can learn more conversion rate optimization tips here.
Average cost per lead in search ads
You could say we saved the best metric in our benchmarks breakdown for last, since most advertisers use cost per lead as their core “money metric.” Cost per lead (also known as cost per conversion, cost per action, or cost per acquisition) determines how much a conversion sourced from a search ad costs your business on average.
The average cost per lead in Google Ads in 2024 is $66.69.
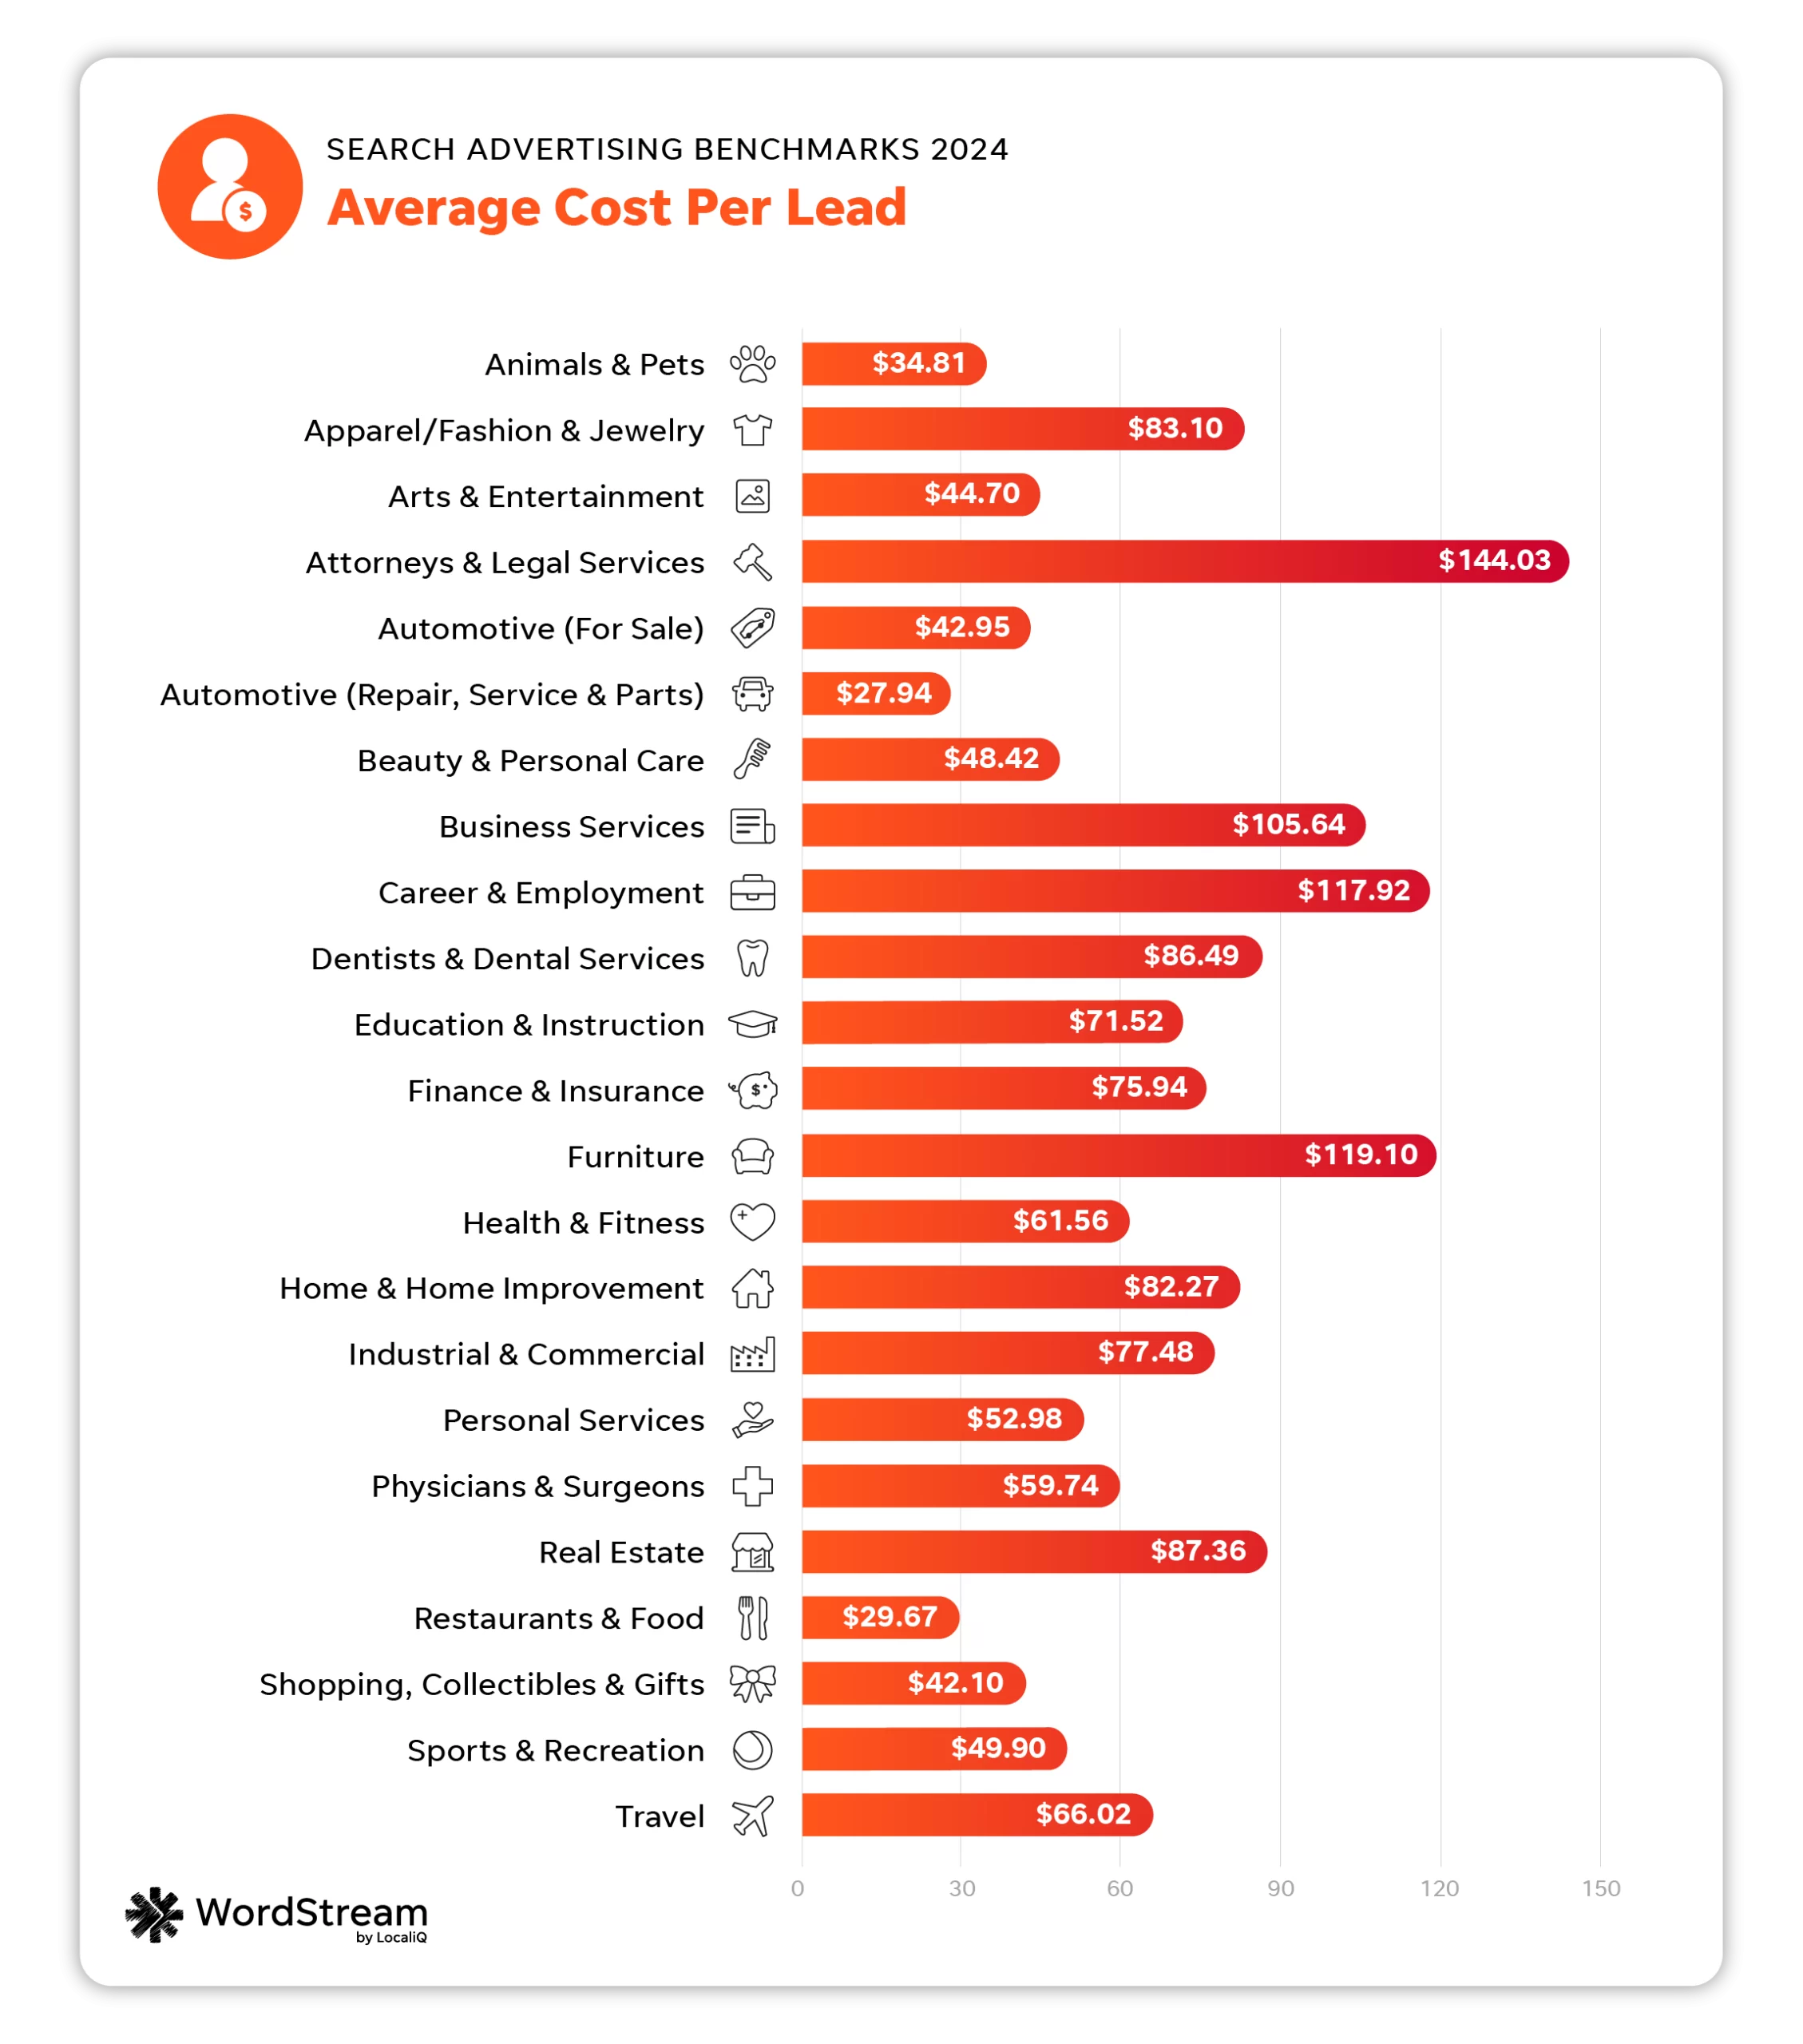
| Business category | Avg. CPL |
| Animals & Pets | $34.81 |
| Apparel / Fashion & Jewelry | $83.10 |
| Arts & Entertainment | $44.70 |
| Attorneys & Legal Services | $144.03 |
| Automotive — For Sale | $42.95 |
| Automotive — Repair, Service & Parts | $27.94 |
| Beauty & Personal Care | $48.42 |
| Business Services | $105.64 |
| Career & Employment | $117.92 |
| Dentists & Dental Services | $86.49 |
| Education & Instruction | $71.52 |
| Finance & Insurance | $75.94 |
| Furniture | $119.10 |
| Health & Fitness | $61.56 |
| Home & Home Improvement | $82.27 |
| Industrial & Commercial | $77.48 |
| Personal Services | $52.98 |
| Physicians & Surgeons | $59.74 |
| Real Estate | $87.36 |
| Restaurants & Food | $29.67 |
| Shopping, Collectibles & Gifts | $42.10 |
| Sports & Recreation | $49.90 |
| Travel | $66.02 |
The industries with the lowest average CPLs were Automotive Repair, Service, and Parts at $27.94, Restaurants and Food at $29.67, and Animals and Pets at $34.81.
Industries with the highest average CPLs included Attorneys and Legal Services ($144.03), Furniture ($119.10), and Career and Employment ($117.92).
In the US versus Google antitrust trial, it was brought to light by the Department of Justice that Google has been increasing advertising costs. This article explains how Google “has the power to raise prices when it desires to do so.”
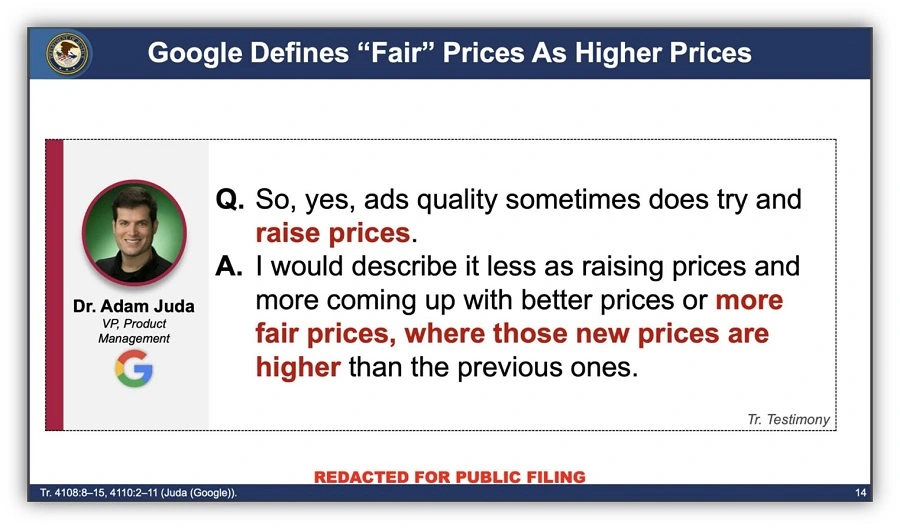
While this could have impacted overall costs for advertisers, it’s important to remember other factors beyond Google’s control (like the number of advertisers in your industry or your chosen account structure) still play a role in your cost per lead. So, if your industry has a higher cost per lead, you can identify ways to combat this—even if, at times, it feels like Google is hiking up prices.
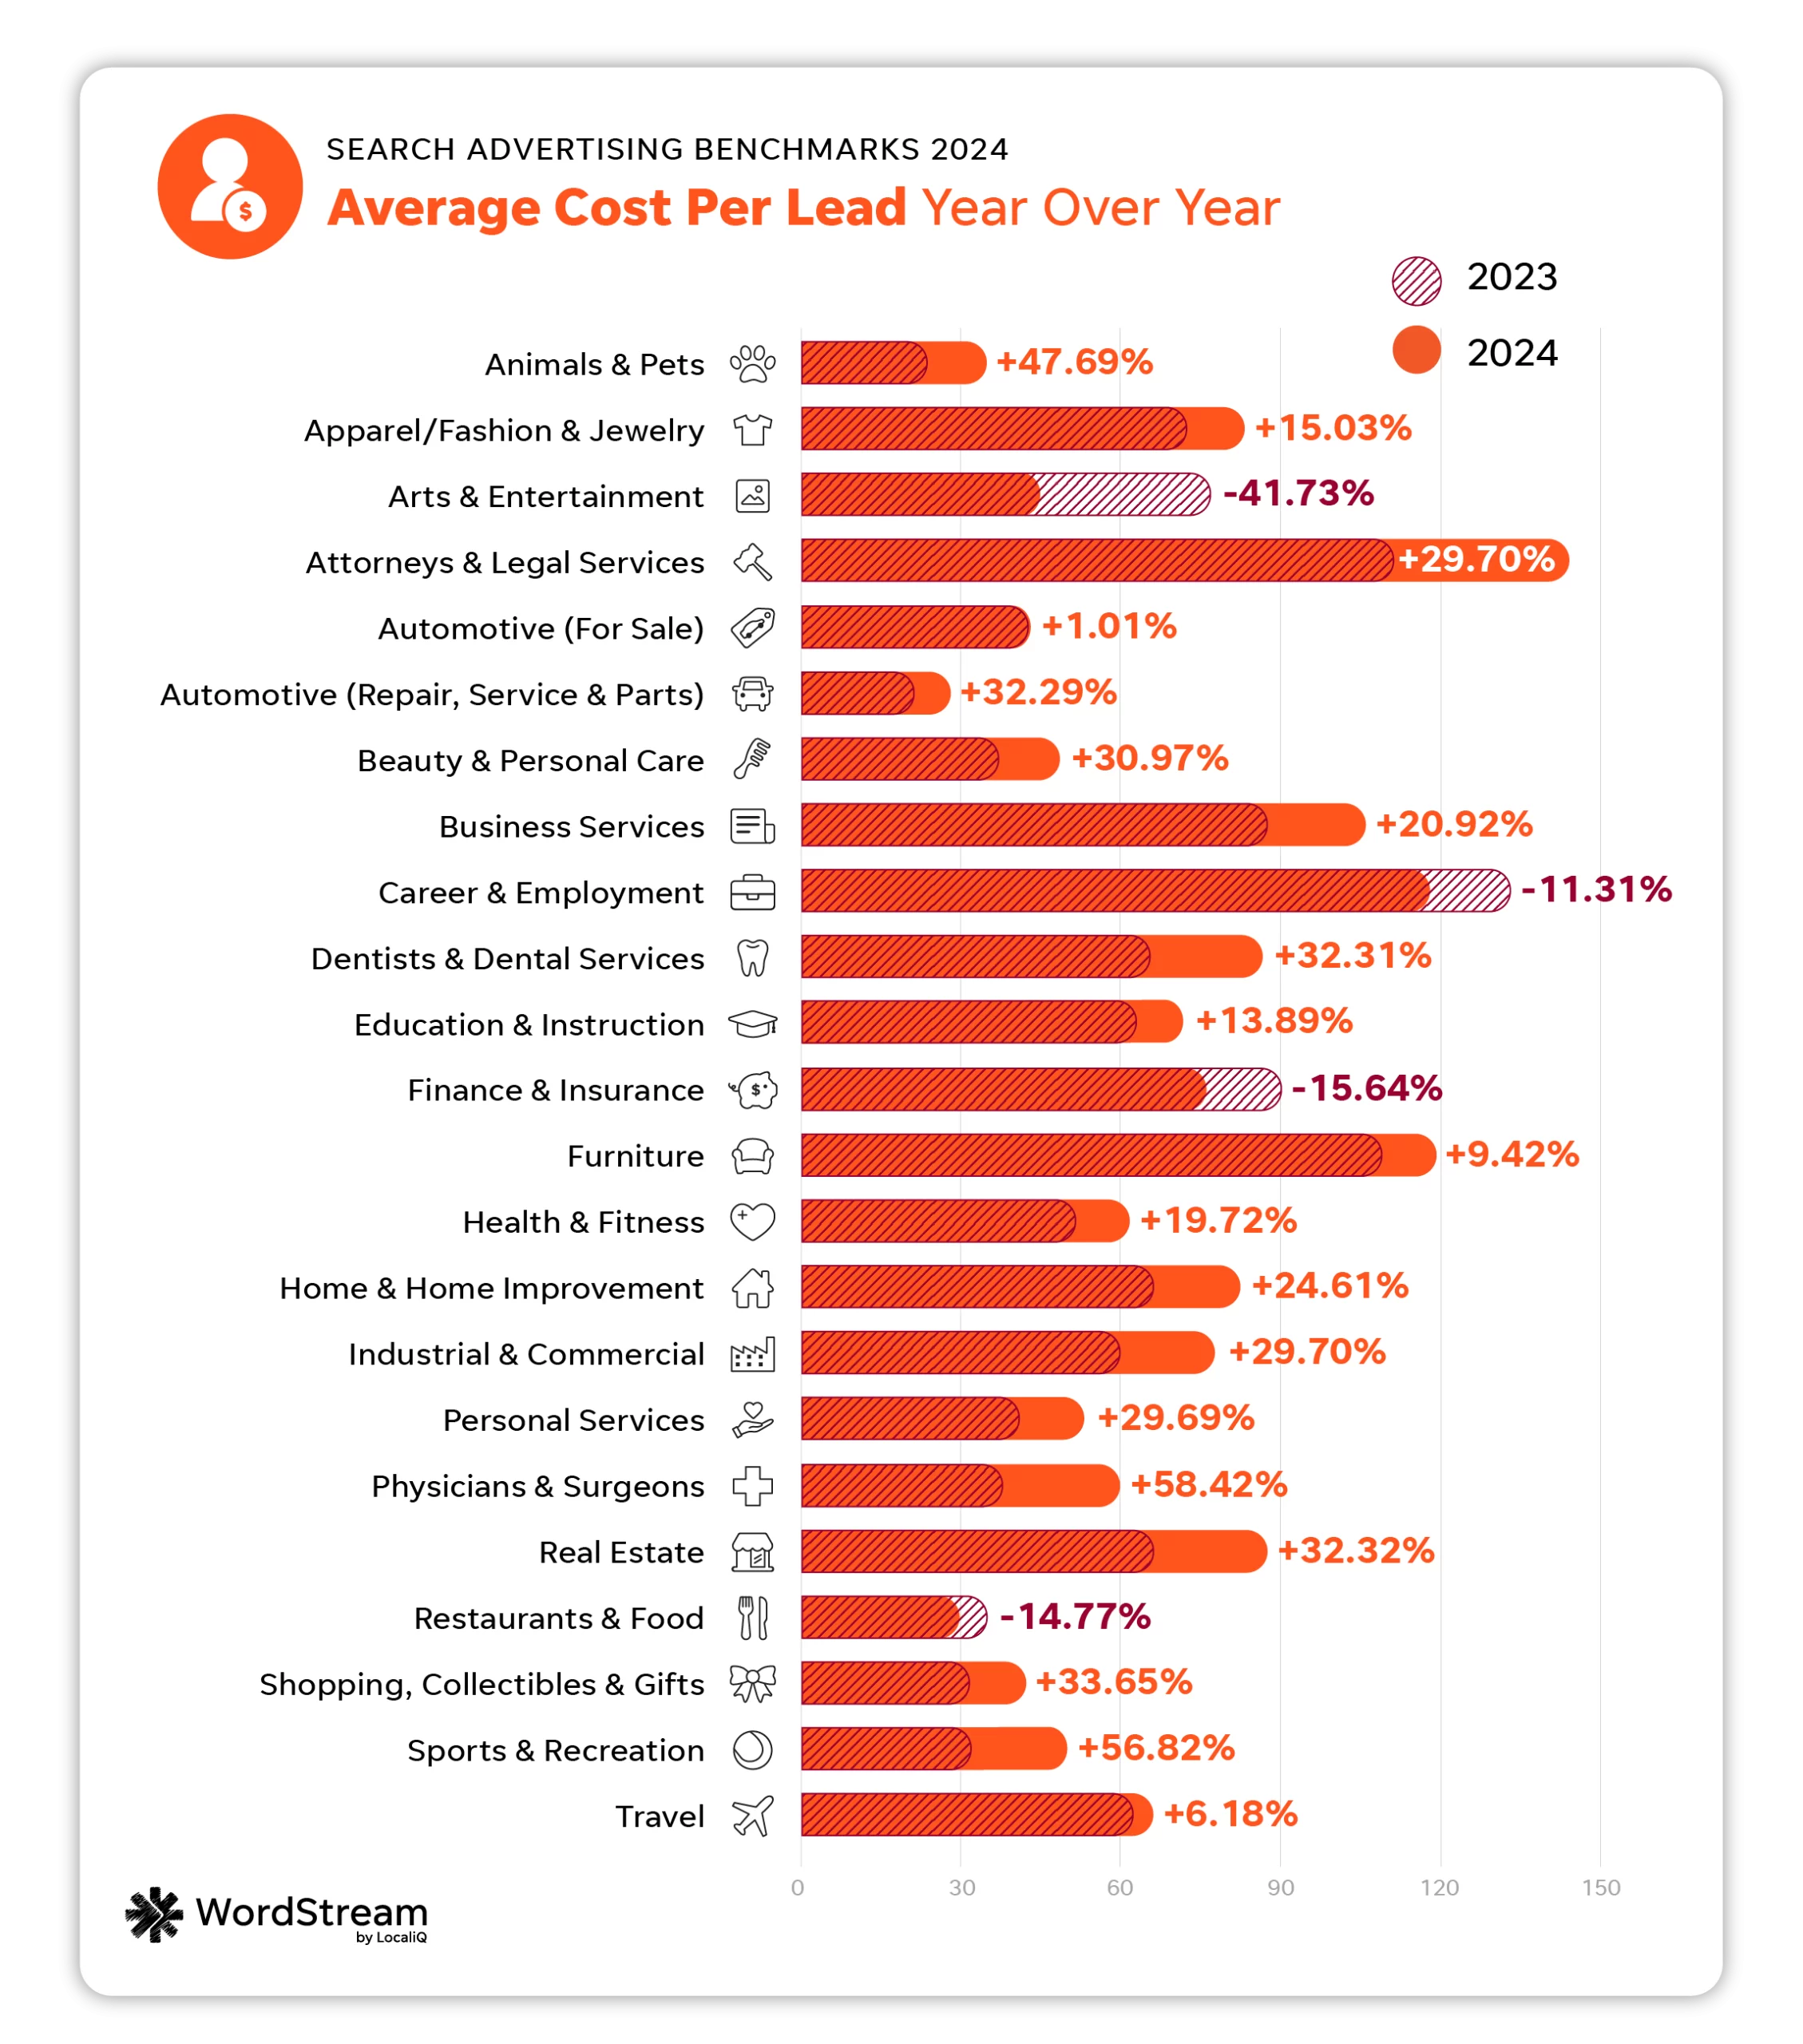
Average cost per lead: YoY
The industries with the biggest improvements in cost per lead were Arts and Entertainment (-41.73%), Finance and Insurance (-15.64%), and Restaurants and Food (-14.77%).
Alternatively, the industries that saw their cost per lead go up year over year were Physicians and Surgeons (58.42%), and Sports and Recreation (56.82%), and Animals and Pets (47.69%).
This year’s overall CPL of $66.69 is $13.17 higher than last year’s average of $53.52.
How to improve cost per lead
While it can be easy to get hung up on how your cost per lead compares to other businesses in your industry, it’s important to focus on what matters to your business’s bottom line and optimize for that.
“This year’s search advertising benchmarks underscore the critical need for campaign optimization. While rising click-through rates suggest a more receptive environment for ads, the cost of clicks increasing, as well as shifts in conversion rates and cost per lead, demonstrate significant variation across industries,” said Katia Hausman, Vice President of Ad Products at LocaliQ.
Keeping in mind that there are some fluctuations and variations when it comes to cost per lead metrics, you may want to see how you can optimize all your campaigns across platforms to bring down your overall cost averages. For example, how you’re attracting and tracking conversions will directly impact your cost per lead numbers.
“This data is actually very surprising—the gains in click-through rate seem to indicate that folks are getting less valuable traffic. Advertisers are doing a great job creating ads to get the user to click, but they may not be able to track the conversions, so cost per lead goes up,” said Navah Hopkins, PPC Evangelist at Optmyzr.
Navah added that there might also be “false positives” within an advertiser’s conversion tracking. This could lead to more low-value actions (such as button clicks) being counted as conversions—skewing conversion numbers to appear higher. Automated bidding strategies would then be thrown off and start to overbid on less valuable ads. This means that businesses need to keep a careful eye on their conversion tracking set-up.
You can uncover more ideas to lower your cost per lead here.
What these search ads benchmarks and trends mean for your business
If you’re wondering how you can take action on these search advertising benchmarks, we’ve got you covered.
1. A holistic approach to your search ad strategy is key
While it can be easy to get preoccupied with individual platform performance, expanding your business’s reach by running ads across multiple search engines is a way to maintain maximum overall marketing ROI.
What to do about it
By running search ads across multiple search engines, including Google and Microsoft, you can maximize your budget and offset potential cost increases.
“As Google Ads CPCs and cost per lead continue to rise, we actually see the reverse in Microsoft Ads. It’s an interesting trend that can help to offset growing costs,” said Katia.
2. AI and automation can boost results
Automation can help you keep your campaign optimized without sacrificing time or results. You can use automation and AI to simplify budget allocation, keyword management, and overall campaign optimizations.
What to do about it
It may take some trial and error, but look for AI-powered options within the platforms that work for your business; it can save you time and money in the long run.
“Don’t overlook the AI-driven features within Google Ads, such as Performance Max, broad match, and Demand Gen campaigns. These can significantly streamline campaign management and drive results, provided they’re fed with high-quality data,” said Alessandro.
3. Data-driven conversion tracking and first-party data are more important than ever
The upcoming deprecation of third-party cookies has been a hot-button topic within the PPC community for some time now. That said, with the sunset of third-party data fast approaching, it’s more important than ever to collect, organize, and act on your business’s owned, first-party data.
What to do about it
“These benchmarks emphasize the necessity for a data-driven approach to target the appropriate audience and optimize campaigns for conversions across all touchpoints (including websites and landing pages) within today’s competitive advertising landscape. Testing various optimization and bidding strategies continues to be instrumental in maximizing campaign performance,” said Katia.
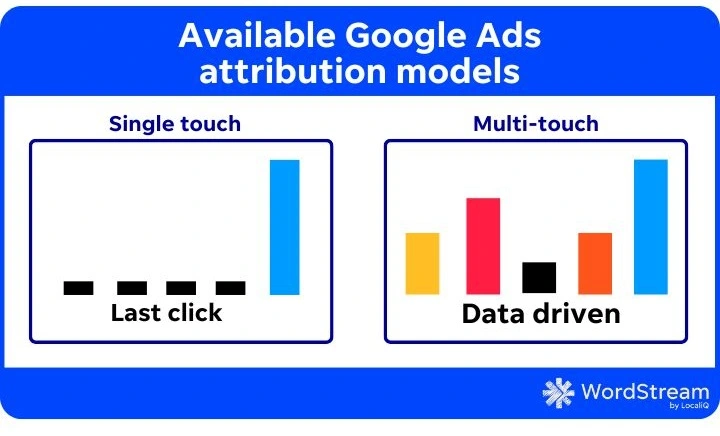
For example, your conversion tracking strategy should pivot to meet the new tracking capabilities Google has rolled out, like data-driven attribution modeling.
“My top tip for enhancing PPC results revolves around comprehensive conversion tracking and leveraging durable tactics to future-proof your setup. Implementing tools like Enhanced Conversions can provide invaluable insights into campaign performance and audience behavior,” said Alessandro.
4. Some metrics might thrive while others fluctuate
If you feel like your search performance is all over the place, you’re not alone. As Google and Microsoft continue to test and change parts of the search journey, results will fluctuate.
What to do about it
You may need to look at other metrics, like return on ad spend (ROAS), to get a clear picture of your search ad progress.
“ROAS helps you assess the profitability of your advertising efforts by measuring the revenue generated for every dollar spent on ads. It helps a lot with understanding how well a PPC campaign is doing when it comes to driving revenue,” said Goran.
You’ll also need to prioritize some metrics over others depending on your goals.
“Most of our discussions focus on CPL and CVR. There can be all sorts of factors leading to more clicks on ads like the placement, blending into organic results, and bidding strategies optimizing for engagement,” said Michelle Morgan, Co-Founder of Paid Media Pros.
“But the real test of an ad campaign is how much business it actually drives. While we pay attention to all metrics, our bigger efforts are focused on ensuring our campaigns are profitable from a CPL and CVR standpoint.”
So, while you may see a decrease in one metric, try to look out for other growth opportunities within your ad accounts.
A typical ad account could still recover from a poor search performance with the right first-party data.
“I don’t think these metrics should be taken as a sign of doom and gloom. Rather, they represent the reality of the privacy-first world,” said Navah.
“If you’re not able to connect your conversions, and if you’re not able to spend to meet thresholds for modeling, you’ll see the vanity metrics go up (like CTR), while conversion rates and CPL flounder.”
5. Additional optimizations to ad assets are making ads more clickable
Not only are ads being incorporated into new search experiences, they also have the ability to blend in with organic results better than they have in the past—which may be part of the reason for the overall increase in CTR.
What to do about it
Take advantage of the optimization options available for your search advertising campaigns.
“Less than a decade ago, when I first made the WordStream benchmarks, the average CTR was 3.17%, and only one industry had a CTR above 6% (I thought that was an outlier at the time). Now the average is twice that! Ambitious advertisers might be able to realistically achieve double-digit CTRs this year with some creative work,” said Mark.
“We’re seeing Google more aggressively add images to their ads with image assets, Google Business Profile image assets, logo assets, and automating those for new advertisers as well. Not only are the ads becoming more attractive, but Google is also making them look less like ads at the same time.”
6. Google’s Search Generative Experience and Gemini can impact ads
The evolution of Google Ads isn’t just apparent from the advertiser’s perspective, but from the searcher’s perspective as well. For example, Google Gemini and the new Search Generative Experience (SGE) is changing how search results are curated and viewed.
“As SGE became more widely used over the past year and ads have been rolled out in that experience, I think we’re seeing that Google is still in the early stages of optimizing that experience for advertisers. Some of the top areas that Google has boasted its SGE product, like shopping and home improvement, are some of the industries where advertisers have the steepest drops in CTR,” said Mark.
“It’s likely that as people turned to Gemini in 2023 (formerly Bard), users may have seen new ad impressions from their AI chat companions. But unfortunately, those ads may not have been as great a response to their detailed organic responses and had relatively low CTRs when compared to more traditional searches. This growing SGE trend may be artificially dragging down the CTRs from advertisers in these industries,” said Mark.
What to do about it
Continue to evolve your ad copy, keyword intent, and landing pages to be more easily pulled into conversation-style search results. Consider what questions your customers may be looking to get answered by Gemini.
“The uptick in CTR, likely fueled by Google’s evolving SERP design, is also something I’ve seen firsthand. However, the data’s emphasis on the disconnect between higher CTR and lower conversions is interesting. In my view, it highlights the growing importance of proper audience targeting and intent optimization in Google Ads,” said Alessandro.
7. Economic shifts correlate with search ad metric fluctuations in certain industries
You might notice that some industries saw more aggressive year over year changes than others. This is no coincidence, as many external economic factors impact certain verticals more than others.
What to do about it
Take note of your industry’s strengths and weaknesses in the search advertising space. For example, if your industry has slowed during times of economic fluctuation, you may need to rethink how you approach your ads when your customers aren’t ready to buy.
“I think the finance and real estate industries are fascinating in how dramatically you’re seeing them change,” said Mark.
“As it becomes clear that interest rates are likely to stay high for a while and all financial advertisers now have less flexibility in their offers, their ads are becoming less competitive and less attractive from the otherwise bleak news on the SERP. However, at least this industry’s CPC is equally becoming less competitive as these advertisers have less of an edge to outbid each other.”
Meanwhile, real estate is seeing similar issues as the financial market, but real estate ads are struggling less.
“Price and mortgage costs may not be call-outs in their ads, but location, features, and new opportunities are much easier to attract clicks on the SERP, so their ads are still performing strong enough to maintain their CTR (and possibly CVR). This justifies for real estate businesses to increase their budgets to remain competitive in an industry that’s struggling offline,” said Mark.
8. Regular PPC audits are more important than ever
If there is one final takeaway from our 2024 Google Ads industry benchmarks report, it’s that staying on top of your account performance this year is critical as industry averages continue to fluctuate year over year.
What to do about it
Try scheduling regular PPC audits to see how your PPC metrics are pacing against the benchmarks in your industry.
“By regularly analyzing and refining keywords, ad copy, targeting, and bidding strategies—businesses can ensure that their ads are reaching the right audience and generating the best possible results.
In marketing and advertising, staying proactive and making data-driven adjustments is what gets rewarded,” said Goran.
Take action on these search advertising benchmarks
When it’s time to measure your PPC performance, and you’re not sure where to start, these benchmarks can be a guiding light. However, try to remember that no two Google Ads accounts are the same. What might work for one advertiser may not work for another. So, keep in mind that there is no right or wrong answer for how you approach your PPC strategy.
That said, using data like the averages in this report can help you make informed decisions about your marketing and advertising. The sooner you start to track and pivot your ad strategy, the better! Plus, if you find you still want more out of your PPC ads as you start optimizing your account, our solutions are here to help you make the most out of your search campaigns.
About the data
This report is based on a sample of 17,998 US-based search advertising campaigns running between Apr 1, 2023, and March 31, 2024. Our proprietary platform dynamically shifts budget between search channels on a campaign-by-campaign basis, but in aggregate, 80-85% of spend was allotted to Google Ads and 15-20% to Microsoft Ads. Each subcategory includes at minimum 70 unique active campaigns. “Averages” are technically median figures to account for outliers. All currency values are posted in USD.


Meet The Author
Susie Marino
Susie is the Senior Content Marketing Specialist at WordStream, where she uses her experience as a PPC consultant to share tips, tactics, and best practices in the ever-evolving marketing and advertising space. Outside of work, Susie loves to get outside for some snowboarding or (once the cold weather melts away) hiking!


Comments
Please read our Comment Policy before commenting.