Bust out your pocket protectors and spectacles: it’s time for the 2023 edition of the Social Media Industry Benchmark Report!
As usual, the report features tons of social media benchmarks and metrics from 14 top industries: Alcohol, Fashion, Financial Services, Food & Beverage, Health & Beauty, Higher Education, Home Decor, Influencers, Media, Nonprofits, Retail, Sports Teams, Tech & Software, and Travel.
Savvy marketers know it’s impossible to evaluate your brand’s social media performance without looking at how competitors in your industry are doing too. That’s why we analyzed more than 5 million posts and 9 billion (!) likes, comments, and favorites on Facebook, Instagram, Twitter, and new this year, TikTok from top brands in every major industry to bring you the freshest social media benchmark data for posting frequency, post types, hashtags, and more.
Now, let’s get benchmarking!
Social Media Benchmark Key Takeaways
| Brands seeing less organic engagement this year. Engagement rates are on the decline for Instagram for the third year in a row but holding pretty steady for Facebook and Twitter. |
|
| Posting frequency is on the decline. Post frequency is flat on Instagram but took a ~20% dive on Facebook and Twitter. |
|
| It’s all about the holiday hashtags. Almost every industry earned top engagement rates from holiday-hashtagged posts, while contests and giveaways were less popular than in other years. |
|
| Every brand should post Reels on Instagram. Reels have officially entered the chat on Instagram, dethroning ever-popular carousels for many industries in the race for the most engaging post type. |
|
| TikTok is topping the charts. With a median engagement rate of 5.69%, TikTok was every industry’s best friend this year. |

Grab the full 2023 Benchmark Report
Download the report nowAll-Industry Social Media Benchmarks
All-Industry: Facebook

Average Facebook engagement rate per post, all industries
The all-industry Facebook median declined a little this year. Tech & Software brands managed a slight increase, and Retail and Travel stayed flat.

Average Facebook posts per week, all industries
Median posting frequency on Facebook declined by a few points this year.

Facebook posts per week vs. engagement rate per post, all industries
Influencers (infrequent posters) and Sports Teams (frequent posters) earn consistently high marks on Facebook despite a big delta in posting frequency.

Average Instagram engagement rate per post, all industries
Instagram engagement rates fell by about 30% this year, which isn’t the news hardworking content creators were hoping for.

Average Instagram posts per week, all industries
The median posting frequency across all industries increased by a hair this year on Instagram.

Instagram posts per week vs. engagement rate per post, all industries
Higher Ed was the clear engagement winner on Instagram despite below-median posting frequency, suggesting more isn’t always better on Instagram (though second-place Sports Teams might beg to differ).

Average Twitter engagement rate per tweet, all industries
Engagement rates were almost flat on Twitter, reminding us that sometimes no news is good news.

Average Twitter tweets per week, all industries
Tweeting frequency decreased by about 20% this year across all industries, which isn’t too surprising given all the Twitter turmoil.

Twitter tweets per week vs. engagement rate per tweet, all industries
Frequent tweeters Higher Ed and Sports Teams came out ahead on Twitter this year, but last-place Media showed other industries that higher tweet frequency isn’t always better.

Average TikTok engagement rate per post, all industries
Higher Ed, Sports Teams, and Financial Services led the pack on TikTok engagement this year.

Average TikTok posts per week, all industries
Media and Health & Beauty brands posted the most on TikTok this year, while Alcohol and Food & Beverage brands brought up the rear.

TikTok posts per week vs. engagement rate per post, all industries
Higher Ed sees epic engagement rates on TikTok but is one of the least frequent posters, while Media brands’ lagging engagement rates prove once again that more posting isn’t necessarily better.

Engagement rate benchmarks vs time, all industries
Engagement rates were fairly flat on Facebook and Twitter, but Instagram engagement rates took a 30% dip this year.
Since this is our first year publishing benchmarks for TikTok, we can’t draw any YoY conclusions there just yet.

Posting frequency benchmarks vs time, all industries
Instagram post frequency was flat this year, while brands decreased their investment in creating content on both Facebook and Twitter.
Alcohol Social Media Benchmarks
Alcohol brands were just one step away from the podium on Facebook and Twitter. These brands earned median engagement rates on Instagram while struggling on TikTok.
A few ways Alcohol brands can keep up the pace:
- Try experimenting with posting frequency, since Alcohol brands consistently post less frequently than other industries.
- Holidays like Father’s Day and Valentine’s Day topped the hashtag charts this year for Alcohol brands.

Overview of all benchmarks, Alcohol
Notable brands in this year’s report include 19 Crimes, Athletic Brewing Co., Genessee Brewery, Hendrick’s Gin, Russian River Brewing, and Stella Rosa Wines.

Facebook posts per week and engagement rate by post type, Alcohol
Alcohol brands were much likelier to post a photo on Facebook than any other post type, which has paid off, since photo posts outperformed all other post types by a mile.

Instagram posts per week and engagement rate by post type, Alcohol
Carousels grabbed the highest engagement rates for Alcohol brands, who were much likelier to post photos on Instagram. Consider combining a few of those single-photo posts into high-performing carousels.

Twitter posts per week and engagement rate by tweet type, Alcohol
Alcohol brands saw the most success with photo tweets this year, but still ran in the middle of the industry pack on Twitter.

Top Instagram hashtags by engagement rate, Alcohol
Alcohol brands rocked holiday hashtags like #BlackFriday and beer-themed hashtags like #Stout and #HazyIPA on Instagram this year.

Top Twitter hashtags by engagement rate, Alcohol
Alcohol followers were quick to smash the like button when tweets mentioned holidays like Father’s Day and Valentine’s Day.

Top TikTok hashtags by engagement rate, Alcohol
It’s no surprise that beer-related hashtags and the ever-present #FYP hashtag were top performers for Alcohol brands on TikTok this year.
Fashion Social Media Benchmarks
Fashion brands were at or near the bottom of the pack on Facebook, Instagram, and Twitter, but earned near-median engagement rates on TikTok.
Some suggestions for Fashion brands:
- Invest more in TikTok, which is paying more engagement dividends than other channels right now.
- Try pulling back on post frequency on Facebook and Instagram with an eye towards higher-quality content.

Overview of all benchmarks, Fashion
Notable brands in this year’s report include Athleta, Good American, House of CB, Lounge, NA-KD, and Stone Island.

Facebook posts per week and engagement rate by post type, Fashion
Photos were twice as engaging as other post types for Fashion brands on Facebook.

Instagram posts per week and engagement rate by post type, Fashion
As for many other industries, Reels and carousels topped the engagement charts for Fashion brands this year.

Twitter posts per week and engagement rate by tweet type, Fashion
Fashion brands were all about the photos this year on Twitter and barely put any energy into low-performing status and link tweets.

Top Instagram hashtags by engagement rate, Fashion
Giveaway-themed hashtags performed 3x as well as the next highest hashtags for Fashion brands on Instagram.

Top Twitter hashtags by engagement rate, Fashion
Giveaway hashtags blew other hashtags out of the water for Fashion brands on Twitter this year.

Top TikTok hashtags by engagement rate, Fashion
TikTok-specific hashtags like #duet and #foryou performed well for Fashion brands, while more standard hashtags like #travel and #dance also earned top engagement.
Financial Services Social Media Benchmarks
Financial Services brands grabbed a fourth-place finish on TikTok while earning below-median engagement rates on Facebook and Instagram and posting less frequently than other industries on these channels.
A few ideas for Financial Services brands:
- Try repackaging video content from other channels for use on TikTok to capitalize on strong engagement rates there.
- Educational hashtags like #FinancialLiteracy and #LearnOnTikTok were top performers, proving FinServ followers are down to learn.

Overview of all benchmarks, Financial Services
Notable brands in this year’s report include BMO, Credit One Bank, Halkbank, Robinhood, Scotiabank, and TD Bank.

Facebook posts per week and engagement rate by post type, Financial Services
Photo posts earn twice the engagement of Financial Services’ next most engaging post type on Facebook, so it’s smart these brands are leaning into the photos.

Instagram posts per week and engagement rate by post type, Financial Services
Carousel posts earned top engagement for Financial Services brands on Instagram this year, with videos and Reels surprisingly bringing up the rear.

Twitter posts per week and engagement rate by tweet type, Financial Services
Status, video, and photo tweets all earned basically the same engagement rates for Financial Services brands on Twitter this year, proving these brands were right to stay away from link tweets.

Top Instagram hashtags by engagement rate, Financial Services
Hashtags like #FinancialLiteracy and #Investing proved educational tweets were also engaging ones for Financial Services brands on Instagram this year.

Top Twitter hashtags by engagement rate, Financial Services
Holiday hashtags like #Father’sDay and #MerryChristmas performed well for Financial Services brands this year, as did industry-related hashtags like #FinTech and #Finance.

Top TikTok hashtags by engagement rate, Financial Services
Financial Services used industry-related hashtags like #FinTok, #FinTech, and #MoneyTips to help followers (and the algorithm) understand the content of their videos.
Food & Beverage Social Media Benchmarks
Food & Beverage brands lagged on Facebook and Instagram when it came to engagement rates and were low posters across the board.
Some ideas for improvement:
- Experiment with posting frequency to see if more posting engages fans better.
- Holidays were a hashtag hit across all channels, as were chances to go #BehindTheScenes with chefs and food personalities.

Overview of all benchmarks, Food & Beverage
Notable brands in this year’s report include Beyond Meat, Body Armor, Breyer’s, G Fuel, Goya Foods, and POCARI SWEAT.

Facebook posts per week and engagement rate by post type, Food & Beverage
No surprise here that delicious photos of snacks and drinks performed well for Food & Beverage brands on Facebook by helping fans eat with their eyes at their favorite restaurants or eateries.

Instagram posts per week and engagement rate by post type, Food & Beverage
Reels were most likely to grab high engagement rates for Food & Beverage brands on Instagram this year despite the industry’s obsession with static photo posts.

Twitter posts per week and engagement rate by tweet type, Food & Beverage
Unlike on Instagram, photo tweets topped the charts for Food & Beverage brands on Twitter this year.

Top Instagram hashtags by engagement rate, Food & Beverage
Healthy eating hashtags like #HealthyFood, #Vegan, and #GlutenFree topped the charts for Food & Beverage brands on Instagram this year.

Top Twitter hashtags by engagement rate, Food & Beverage
Holidays like #ValentinesDay dominated for Food & Beverage brands on Twitter this year as followers posted pics from romantic meals.

Top TikTok hashtags by engagement rate, Food & Beverage
The #viral hashtag definitely did its job for Food & Beverage brands on TikTok this year. Followers also enjoyed a #BehindTheScenes look at what their favorite restaurants or chefs were up to.
Health & Beauty Social Media Benchmarks
Health & Beauty brands struggled to engage fans and followers compared to their fellow industries, earning engagement rates that were about half the median across all four channels.
A few growth ideas:
- Continue favoring TikTok and Instagram while keeping efforts low on Twitter, which doesn’t have much engagement payoff in this industry.
- Investing in Reels content is working—keep going.

Overview of all benchmarks, Health & Beauty
Notable brands in this year’s report include Avoskin, Emina Cosmetics, Haus Labs, Primor, PÜR, and Voluspa.

Facebook posts per week and engagement rate by post type, Health & Beauty
Health & Beauty brands were three times likelier to post a photo on Facebook than any other post type, which paid off with the highest engagement rates of the bunch.

Instagram posts per week and engagement rate by post type, Health & Beauty
Reels performed well for Health & Beauty brands this year thanks in part to a strong investment in creating that type of post on the regular.

Twitter posts per week and engagement rate by tweet type, Health & Beauty
Photo tweets performed about 50% better than other tweet types for Health & Beauty brands on Twitter this year.

Top Instagram hashtags by engagement rate, Health & Beauty
The #MerryChristmas hashtag brought the holiday spirit by performing twice as well for Health & Beauty brands as the next most engaging Instagram post this year.

Top Twitter hashtags by engagement rate, Health & Beauty
Health & Beauty Twitter followers jumped at the chance to score free swag with #giveaway posts, and holiday- and skincare-themed hashtags were also a hit.

Top TikTok hashtags by engagement rate, Health & Beauty
Like many industries, Health & Beauty was all about the TikTok hashtags that helped users easily identify what videos were about like #HairRoutine and #LipCombo.
Higher Ed Social Media Benchmarks
Colleges and universities earned gold with 5x the median engagement rate on Instagram and 3x the engagement rate on Twitter. Higher Ed also rocked the bronze on Facebook and the silver on Twitter thanks to engaging content.
For even higher Higher Ed engagement rates:
- Don’t be afraid to shake up post types beyond photos.
- Followers love posts hashtagged with campus activities like #graduation or #CollegeMoveIn, so don’t be afraid to give a taste of college life.

Overview of all benchmarks, Higher Ed
Notable schools in this year’s report include Louisiana State University, United States Naval Academy, Siena College, Syracuse University, Texas Christian University, and the University of San Francisco.

Facebook posts per week and engagement rate by post type, Higher Ed
Photo posts earned twice the engagement of the next most engaging post type on Facebook for Higher Ed this year.

Instagram posts per week and engagement rate by post type, Higher Ed
Carousel posts earned top engagement on Instagram this year for Higher Ed while video posts lagged big time. Just look at the University of Chicago for some carousel inspo: their most engaging post of the year was a homecoming wrap-up post.

Twitter posts per week and engagement rate by tweet type, Higher Ed
Links underperformed on Twitter for Higher Ed this year, while photos and videos earned much higher engagement rates.

Top Instagram hashtags by engagement rate, Higher Ed
Higher Ed Instagram followers ate up posts about the newest students admitted with the #Classof2026 hashtag, which performed about 50% better than the next highest-performing hashtag.

Top Twitter hashtags by engagement rate, Higher Ed
Colleges and universities were all about holiday-themed hashtags on Twitter this year.

Top TikTok hashtags by engagement rate, Higher Ed
#HESM-themed hashtags like #graduation and #college earned astronomical engagement rates on Higher Ed TikTok this year.

Hungry for more benchmarking? We’ve got the definitive guide to all things Instagram Stories.
Grab the guideHome Decor Social Media Benchmarks
Home Decor brands earned engagement rates towards the bottom of the pack on Facebook, Instagram, and Twitter. These brands were most competitive on TikTok, and focused efforts there.
Some ideas for increasing engagement:
- Ride that TikTok success by increasing posting and engagement with followers.
- Giveaways are gold on Instagram, so keep up investment there.

Overview of all benchmarks, Home Decor
Notable brands in this year’s report include Arhaus, Dwell, The Home Edit, Pampered Chef, Urban Barn, and Velux.

Facebook posts per week and engagement rate by post type, Home Decor
Home Decor brands were way likelier to post a photo on Facebook than any other post type, which is a smart move, since photos grabbed much higher engagement rates.

Instagram posts per week and engagement rate by post type, Home Decor
Home Decor brands were 4x as likely to post photos as any other post type. Try investing a little more in Reels, which earned top engagement rates this year.

Twitter posts per week and engagement rate by tweet type, Home Decor
Home Decor brands might want to experiment with status tweets, which outperformed every other tweet type this year.

Top Instagram hashtags by engagement rate, Home Decor
Giveaway-tagged posts earned about 3x the engagement rates of the next most engaging Instagram hashtag for Home Decor brands this year, proving contests and giveaways are always a good idea.

Top Twitter hashtags by engagement rate, Home Decor
Contests and giveaways dominated for Home Decor brands on Twitter this year, with holiday hashtags like #BlackFriday and #Christmas also performing well.

Top TikTok hashtags by engagement rate, Home Decor
Home Decor brands used hashtags like #TipsAndTricks and #HomeInspo to inspire and educate fans and followers.
Influencers Social Media Benchmarks
Influencers earned 4x the median engagement rate on Facebook for a silver medal, and also killed it on Instagram. Influencers posted right around the median frequency on all three channels, suggesting they’ve dialed in how often to post on social.
Ideas to boost that engagement even more:
- Photos continue to be a great place to focus efforts on Facebook.
- Holiday-themed hashtags performed well for Influencers, as did hustle-focused hashtags like #entrepreneur and #business.

Overview of all benchmarks, Influencers
Notable Influencers in this year’s report include Song of Style, Dr. Daniel Amend, Jordan Belfort, Marie Forleo, Oneika the Traveller, Patrick Bet-David, Sorav Jain, and Suze Orman.

Facebook posts per week and engagement rate by post type, Influencers
Photos perform about twice as well as the next most engaging post type for Influencers, so concentrating efforts here is a smart move.

Instagram posts per week and engagement rate by post type, Influencers
Reels, photos, and carousels earned near-equal engagement for Influencers this year on Instagram while video lagged behind.

Twitter posts per week and engagement rate by tweet type, Influencers
Status updates were the most engaging tweet type for Influencers this year but were tweeted the least often of any tweet type.

Top Instagram hashtags by engagement rate, Influencers
Influencers weren’t afraid to get entrepreneurial on Instagram this year with hashtags like #Business, #Leadership, and #Entrepreneur.

Top Twitter hashtags by engagement rate, Influencers
#tbt was the top-performing hashtag for Influencers on Twitter this year, suggesting followers enjoyed getting to know content creators.

Top TikTok hashtags by engagement rate, Influencers
TikTok-themed hashtags like #fyp, #viral, and #trend helped Influencers hop onto the For You Page of fans and followers.
Media Social Media Benchmarks
Media posted much more frequently than the median industry across all four channels but struggled to earn top engagement rates. These brands saw the most engagement success when keeping posting frequency in check on Instagram and TikTok.
A few ideas to improve engagement rates:
- Hashtags based on current events will never go out of style for Media brands.
- Go beyond the link: visual posts like photos and videos performed way better.

Overview of all benchmarks, Media
Notable brands in this year’s report include CBC, Daily Hive Vancouver, Hello Sunshine, Love Nature, The Telegraph, and Vice News.

Facebook posts per week and engagement rate by post type, Media
Videos and photos rock top engagement rates for Media brands on Facebook, though these brands were more than 15x as likely to post a link.

Instagram posts per week and engagement rate by post type, Media
Reels earned about twice the engagement rates of video posts for Media brands on Instagram this year.

Twitter posts per week and engagement rate by tweet type, Media
Once again, Media brands heavily favored link tweets, but might want to invest more energy in video tweets, which grabbed more than 3x the engagement rates.

Top Instagram hashtags by engagement rate, Media
As you’d expect from outlets reporting on everything from the environment to current events, Media brands used a diverse array of hashtags on Instagram this year primarily related to trending topics like #50Cent and #JenniferAniston.

Top Twitter hashtags by engagement rate, Media
Just like on Instagram, hashtags on Twitter ranged far and wide for Media brands and earned low engagement rates.

Top TikTok hashtags by engagement rate, Media
Media brands used a diverse array of hashtags on Twitter this year, with #SonsOfAnarchy and #ShiaLaBeouf topping the charts.
Nonprofits Social Media Benchmarks
Nonprofits saw above-median engagement rates across all social channels this year and posted more often than the median industry, especially on Twitter.
Suggestions for Nonprofits:
- Don’t be afraid to play with posting frequency to try to replicate these stellar engagement rates with fewer posts.
- Investing in video content is a must across all channels for 2023.

Overview of all benchmarks, Nonprofits
Notable nonprofits in this year’s report include Action for Children, American Diabetes Association, Elton John AIDS Foundation, Habitat for Humanity, Oxfam America, and Women’s March.

Facebook posts per week and engagement rate by post type, Nonprofits
Photos earned top engagement rates for Nonprofits this year, who shared this post type 4x more often than any other.

Instagram posts per week and engagement rate by post type, Nonprofits
Unlike many other industries, Nonprofits saw relatively similar engagement rates no matter the post type on Instagram this year, with carousel posts leading the pack as usual.

Twitter posts per week and engagement rate by tweet type, Nonprofits
Videos earned top engagement rates for Nonprofits this year on Twitter, but the extra work that goes into producing a video meant photo and link tweets were more common for these organizations.

Top Instagram hashtags by engagement rate, Nonprofits
Holiday and seasonal hashtags like #Halloween, #Winter, and #BackToSchool earned top marks for Nonprofits on Instagram this year.

Top Twitter hashtags by engagement rate, Nonprofits
Nonprofits used hashtags on Twitter to tackle issues like #WorldMentalHealthDay and #LGBTQIA+ rights.

Top TikTok hashtags by engagement rate, Nonprofits
Hashtags like #comedy and #BehindTheScenes stood way, way out for Nonprofits on TikTok this year, while holiday-themed hashtags also earned epic engagement rates.
Retail Social Media Benchmarks
Retail brands trailed behind other industries across all four channels this year, earning last-place engagement rates on Instagram and second-to-last on Facebook.
Some ideas for improving social performance this year:
- Stick with photo posts to help drive up engagement while also experimenting with video, especially Reels and TikToks.
- Don’t be afraid to use holiday- or product-themed hashtags to help fans and followers imagine Retail products in their spaces.

Overview of all benchmarks, Retail
Notable brands in this year’s report include Goop, Lowe’s, The Perfume Shop, Reshoevn8r, Seattle Coffee Gear, and The Brick.

Facebook posts per week and engagement rate by post type, Retail
Photos earned 50% higher engagement rates than the next most engaging post type for Retail brands on Facebook, so this was a smart place to concentrate efforts.

Instagram posts per week and engagement rate by post type, Retail
Reels rocked for Retail brands on Instagram this year and helped Igloo Coolers grab the Retail Instagram engagement rate gold.

Twitter posts per week and engagement rate by tweet type, Retail
Retail brands saw engagement rates that were below the median this year, so leaning into top-performing photo tweets is a strong strategy.

Top Instagram hashtags by engagement rate, Retail
Retail brands helped fans and followers visualize holiday decoration ideas with hashtags like #ChristmasLights and #HalloweenIdeas.

Top Twitter hashtags by engagement rate, Retail
#Competition-hashtagged tweets earned twice the engagement rates as the next most engaging hashtag for Retail brands on Twitter this year.

Top TikTok hashtags by engagement rate, Retail
Hashtags that helped Retail brands show off their products like #haul, #OutfitInspo, and #SelfCare performed well on TikTok this year.
Sports Teams Social Media Benchmarks
Sports Teams saw top engagement rates on Facebook and Twitter and were runners-up on Instagram and TikTok. Pretty impressive, especially since high posting frequency meant lots of chances to engage followers.
Some ways to improve engagement rates even more:
- Posting early and often is working, so keep it up.
- Event-based hashtags like #FIFAWorldCup and #SuperBowl energized fans while helping them tune into big games.

Overview of all benchmarks, Sports Teams
Notable Sports Teams in this year’s report include Oakland Athletics, Canadian Olympic Committee, Los Angeles Football Club, Leeds United Football Club, Phoenix Mercury, and the New Jersey Devils.

Facebook posts per week and engagement rate by post type, Sports Teams
Photo posts on Facebook helped Sports Teams earn more than 4x the median engagement rate on this channel, putting these brands comfortably in first place.

Instagram posts per week and engagement rate by post type, Sports Teams
Reels earned killer engagement rates for Sports Teams on Instagram this year even though they were posted less frequently than static post types. Sports Teams like the high-performing Czech Olympic team maximized engagement with Reels.

Twitter posts per week and engagement rate by tweet type, Sports Teams
Sports Teams were twice as likely to tweet a photo as any other tweet type on Twitter this year.

Top Instagram hashtags by engagement rate, Sports Teams
No surprise that Sports Teams saw high engagement on Instagram with World Cup hashtags.

Top Twitter hashtags by engagement rate, Sports Teams
Event-themed hashtags like #FIFAWorldCup and #SuperBowl helped Sports Teams succeed on Twitter, and fans also loved when teams moved to a #NewProfilePic.

Top TikTok hashtags by engagement rate, Sports Teams
Top hashtags on TikTok included a diverse array of sports like #Futbol, #NFL, and #Baseball.
Tech & Software Social Media Benchmarks
Tech & Software brands earned median engagement rates on Instagram and Twitter while struggling on Facebook and TikTok.
Here are two ideas for improving engagement rates:
- Experiment with post types to go beyond the photo posts.
- Holiday-themed hashtags were a hit, so continue to lean into #HappyNewYear- and #Halloween-themed posts.

Overview of all benchmarks, Tech & Software
Notable brands in this year’s report include 64 Audio, Atari, Amazon Web Services, Lenovo, Life360, and Slack.

Facebook posts per week and engagement rate by post type, Tech & Software
Photos grabbed great engagement rates on Facebook for Tech & Software companies like NordVPN.

Instagram posts per week and engagement rate by post type, Tech & Software
Carousels and Reels earned comparable engagement for Tech & Software brands that still heavily favored photo posts on Instagram.

Twitter posts per week and engagement rate by tweet type, Tech & Software
Status and photo tweets earned neck-and-neck engagement rates, but Tech & Software brands were about 20x likelier to post the latter tweet type.

Top Instagram hashtags by engagement rate, Tech & Software
No surprise that tech-themed hashtags like #digital, #technology, and #AI performed well for Tech & Software brands on Instagram this year.

Top Twitter hashtags by engagement rate, Tech & Software
Holiday-themed hashtags like #HappyNewYear and the nerdy #MayThe4thBeWithYou dominated for Tech & Software brands on Twitter this year.

Top TikTok hashtags by engagement rate, Tech & Software
Like many other industries, Tech & Software brands leaned into TikTok-themed hashtags this year like #ForYou, #FYP, and #Duet.
Travel Social Media Benchmarks
Travel brands grabbed the bronze on TikTok and earned about 150% the engagement rates as the median industry on Facebook this year while running in the middle of the pack on Instagram and Twitter.
A few suggestions to grow engagement:
- Seasonal and destination hashtags performed especially well on Instagram, Twitter, and TikTok.
- Posting frequency was below-median across the board, so experiment with an uptick here to see if you can increase your current engagement rates.

Overview of all benchmarks, Travel
Notable brands in this year’s report include Four Seasons, Marriott Bonvoy Hotels, Ritz Paris, SANDALS Resorts, The Venetian, and Vidanta.

Facebook posts per week and engagement rate by post type, Travel
Photos were about twice as engaging as the next best post type on Facebook for Travel brands.

Instagram posts per week and engagement rate by post type, Travel
Reels outperformed other post types for Travel brands this year, who were about 4x more likely to post a photo than any other post type.

Twitter posts per week and engagement rate by tweet type, Travel
No surprise that it’s all about the visuals for Travel brands on Twitter, with video and photo tweets performing about twice as well as link and status tweets.

Top Instagram hashtags by engagement rate, Travel
Christmas-themed hashtags like #ChristmasTree and #FestiveSeason helped Travel brands excite fans and followers on Instagram this year.

Top Twitter hashtags by engagement rate, Travel
Holiday-themed hashtags performed well for Travel brands on Twitter, as did anything involving #breakfast.

Top TikTok hashtags by engagement rate, Travel
No surprise that Travel brands were all about the destination this year on TikTok with location-based hashtags like #Thailand and #NYC.
Methodology
To spot trends and identify benchmarks, we used Rival IQ to analyze engagement rates, posting frequency, post types, and hashtags on the top four social channels for brands: Facebook, Instagram, TikTok, and Twitter.
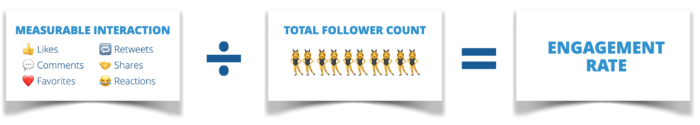
We define engagement as measurable interaction on social media posts, including likes, comments, favorites, retweets, shares, and reactions. Engagement rate is calculated based on all these interactions divided by total follower count.
Within this report, we provide a representative sample of organic and paid posts from national and international companies in each industry by selecting 150 companies at random from each industry* in our database of over 200,000 companies. Companies selected had active presences on Facebook, Instagram, TikTok, and Twitter as of January 2022, and had Facebook fan counts between 25,000 and 1,000,000 and minimum Instagram and Twitter followers of 1,000 as of the same date.

We used median performance from the companies selected for each industry to compile the data for this report.

*Due to limitations about how Alcohol brands can create content on TikTok, we were unable to source the full 150 brands in this industry. The data for Alcohol brands is a representative sample of brands that met our criteria for this channel. We hope to have a more complete picture of Alcohol performance on TikTok next year.
Why do we benchmark?
Social media success is about so much more than getting the most comments or likes: it’s about increasing engagement while also growing or maintaining the percentage of your audience that engages as you expand your audience.
To us, engagement rate per post is the metric because it controls for post volume and audience size and helps marketers understand how they’re doing in relation to their competitors.
Why can’t you gauge success on likes alone? Because audience size is hugely important: 1,000 likes makes a huge difference to a brand with 2,000 followers, but is a drop in the bucket to a brand with 100,000 followers.
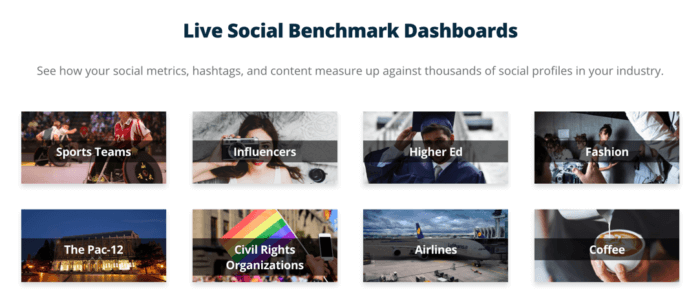
Live Social Media Benchmarks
Ready to start benchmarking your social media performance? Check out our Live Benchmark landscapes, where we feature live social media metrics from a sample of companies from each industry represented in this study. These landscapes feature hashtag performance, top post types, and so much more on Facebook, Instagram, and Twitter.
(Oh, and if you’re a Rival IQ customer or in a trial, you can add those stats directly into your Rival IQ account for even more comparisons.)
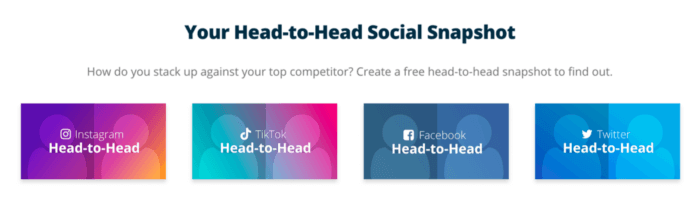
Or, run a free Head-to-Head report against your biggest rival to see how you measure up to both your competition and against industry benchmarks represented in this study.
Wrapping It Up
2022 was a weird year for social media: watching Instagram’s engagement rates decline is a big bummer for marketers, but keeping Facebook and Twitter flat (if low) reminds us it could be worse. Watching Twitter tumble created a lot of uncertainty, while TikTok’s engagement rate and addicted fan base injected some much-needed engagement into the world of social media marketing and beyond.
TikTok videos and Instagram Reels are where it’s at for engagement for many of the industries we studied, proving what we all know: video is here to stay. Getting a foot in the door on TikTok is more important than posting a highly-produced video, so bust out that iPhone and start shooting. And don’t sleep on tried-and-true carousels if video feels too daunting.
As always, we’d love to hear how your brand measures up and is preparing for social media in 2023, so feel free to ping us on Twitter.

Start analyzing with a free Rival IQ trial.
Get my free trial