With over three billion monthly active users reported at the end of 2023, Facebook continues to be a top social media platform that should be part of any brand’s marketing strategy. Its massive reach and diverse user base make it a platform that continues to offer plenty of opportunities for brands to engage with their audience and boost visibility.
And as any marketer knows, the key to understanding whether or not your Facebook marketing efforts are paying off is to have a reliable way to measure your content’s performance — this is where a benchmark engagement rate comes in. But in a world where paid content rules and generating organic reach to cut through the noise is more challenging than ever, what’s considered a good engagement rate on Facebook these days?
Below, let’s go over what a good Facebook engagement rate is, how marketers can calculate engagement rate for their brand, and a few examples from the top-performing industries on Facebook so you can optimize your upcoming content and increase Facebook engagement.
How to Calculate Your Facebook Engagement Rate
Before we dive into what a good engagement rate on Facebook is in 2024, it’s important to point out what exactly counts as engagement. At Rival IQ, we define engagement as measurable interaction on social media posts. Facebook engagement includes likes, comments, favorites, shares, and reactions.
Facebook engagement rate is calculated based on all of these interactions divided by total follower count.

This formula will give you the Facebook engagement rate per post. To us, the engagement rate per post is the most accurate metric to help marketers understand how they’re doing in relation to their competitors. Engagement rate per post takes into account post volume and audience size, so it reveals what content is resonating with your audience regardless of how many followers you have.

Know what your Facebook engagement rate is with a free Rival IQ trial.
Get started nowWhat is a Good Engagement Rate on Facebook?
According to our 2024 Social Media Industry Benchmark Report, the median engagement rate for Facebook is 0.063%. Out of the top 25% of brands across all industries — the brands performing best on social media — the median engagement rate is 0.19%. Using those numbers as your baseline, it’s clear to see what number you need to reach to have a good engagement rate on Facebook and what your objective should be if you want to perform above the average rate.
Another factor that goes into engagement rate on Facebook is the posting frequency. When it comes to how often to post on Facebook, the median for brands across all industries is 4.69 times per week while brands in the top 25% for engagement post 4.6 times per week.
Overall rate across industries:
- Median engagement rate: 0.063%
- Median posting frequency: 4.69 posts per week
Overall rate for brands in the top 25%:
- Median engagement rate: 0.19%
- Median posting frequency: 4.6 posts per week
Facebook Engagement Rate by Industry
While it’s a good idea to reference the average engagement rate across all industries, every industry has its own unique set of metrics. Comparing your engagement rate to similar brands helps provide better insight into how your brand is performing in relation to the industry.
Let’s take a look at the breakdown of a few industries along with examples of brands that are not only receiving high engagement within their own industry, but have posts with higher engagement than the overall median engagement rate.
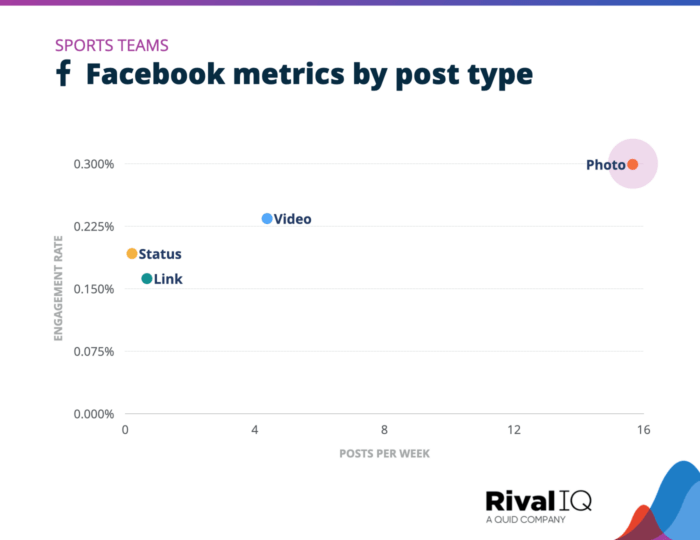
Sports Teams
- Sports Teams Median Engagement Rate: 0.295%
- Sports Teams Median Posting Frequency: 24.29 Facebook posts per week
Sports Teams are the top performers on Facebook across all industries with an engagement rate of 0.295%, which is nearly five times higher than the median engagement rate. Sports Teams also have the highest posting frequency after Media brands, posting just over 24 Facebook posts per week.
Posting often is clearly working for these athletic brands, which makes sense when you consider their fan base seeks out real-time game updates, team announcements, and more.
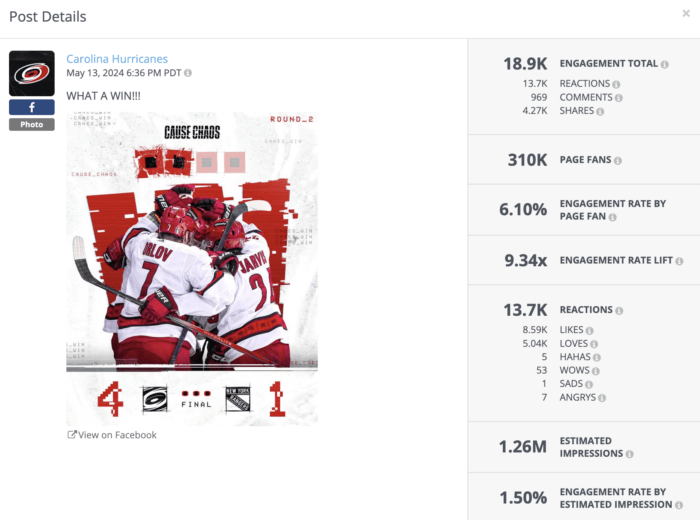
The Carolina Hurricanes are a top-performing team on Facebook with an average engagement rate of 0.66% from posts within the past year. Posting about 26 times a week, the hockey team is slightly more active than the average sports team.
One of the Hurricanes’ top-performing posts was the photo below — a well-designed graphic that featured a team celebration and the score of a recent win.
While the post is fairly straightforward, it effectively taps into the community spirit of sports lovers, boosting engagement by acting as a central point for fans to celebrate and discuss the game. Case in point, the photo earned a killer engagement rate of 6.10%, more than 20 times higher than the average rate for Sports Teams.
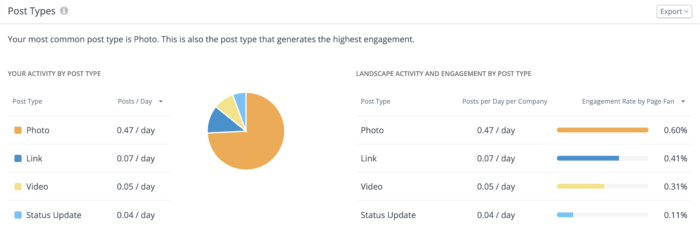
The Hurricanes’ Facebook strategy has a major emphasis on posting photos, with the format being its most common and most engaging post type. It makes sense. Sports teams, as a whole, see the most success with photos on Facebook, as our data below shows.
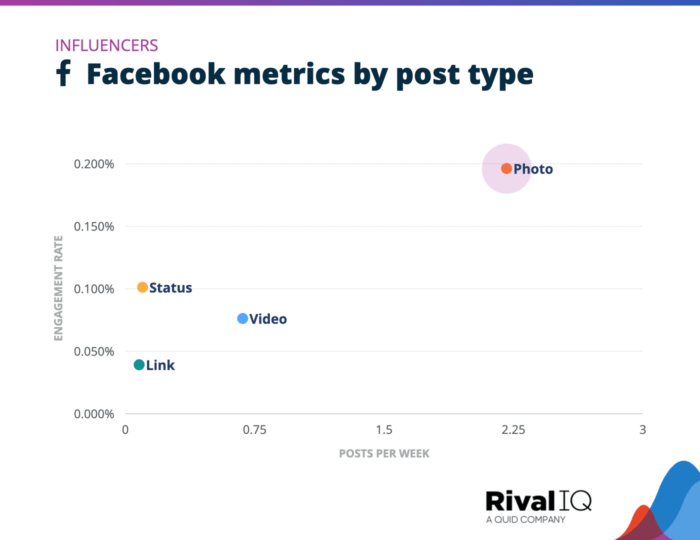
Influencers
- Influencers Median Engagement Rate: 0.164%
- Influencers Median Posting Frequency: 3.86 Facebook posts per week
Influencers are also top performers on Facebook with an average engagement rate of 0.164%, earning 2.6 times the median engagement rate on Facebook across industries. For influencers, Photos are the most engaging and most frequently shared post type.
One example of a highly engaging Photo post comes from influencer Marly Bird. Bird is a knitwear and crochet designer (and teacher) who shares tutorials, creations, and knitting knowledge with her engaged audience across Facebook, Instagram, and YouTube.
On Facebook, she regularly posts photos of pieces she’s made, patterns that people can try out, and educational blog posts from her website. But what really makes her stand out is her personable approach to engaging with her audience.
In the Facebook post below, Bird asks a simple question: “What time and day is it when you see this post?” The photo emphasizes the caption, featuring the words “When?” and a Bitmoji of Bird. With an engagement rate of 2.27%, this post was nearly 14 times more engaging than the average influencer post and 36 times more than the average across industries.
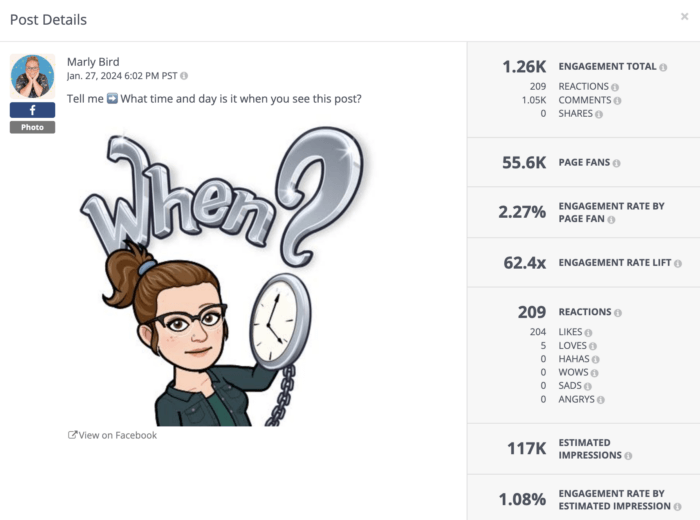
The post’s high engagement is a testament to the community that Bird has built on Facebook. By asking her audience questions about themselves, she not only invites genuine interaction but also strengthens her bond with her community of followers.
And though photo posts are the most popular post type on the platform, they aren’t limited to single-image posts. Sharing multiple photos in an album also performs well on Facebook. For example, Marly Bird posted multiple photos in her post below, documenting her trip to Eugene, Oregon. The pictures featured herself, as well as the knitting project she planned to work on during the flight.
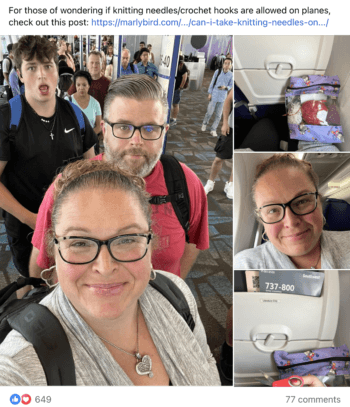
This post aligned with her personable approach. It gave her followers a glimpse into her life, while also adding value through a relevant blog post that she shared about whether knitting needles/crochet hooks are allowed on planes.
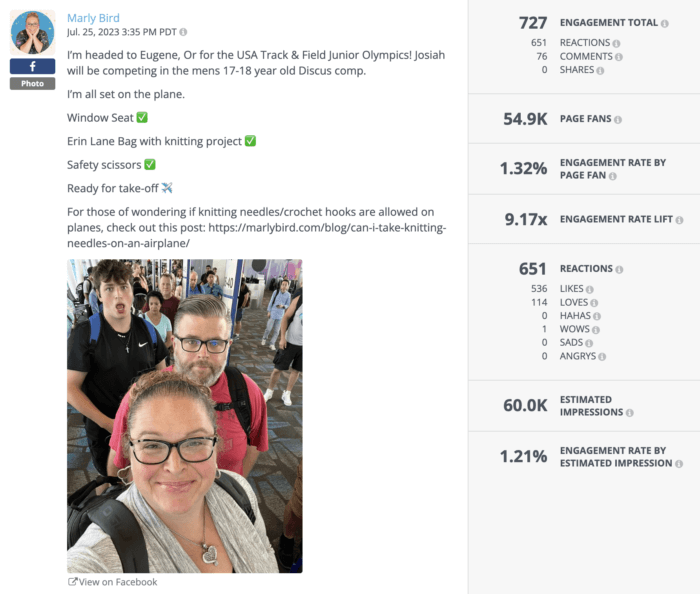
The result? The post earned Bird an engagement rate of 1.32%. That’s eight times higher than the average rate for influencers on Facebook and about 21 times better than the all-industry engagement rate.
There are a couple of key takeaways from both of these posts. For starters, after being active on the platform for years and years, influencers clearly have a handle on Facebook. They understand their audience and know what they want to see. For Bird, it’s genuine efforts to engage with the community along with a relatable look into the life of a knitter and crocheter.
The second takeaway for influencers is that they don’t need to share an overly-produced version of themselves or their brand in order to generate good engagement rates. Simple photos — with or without a CTA — are more than enough to engage their audience.
Higher Education
- Higher Education Median Engagement Rate: 0.158%
- Higher Education Median Posting Frequency: 6.16 Facebook posts per week
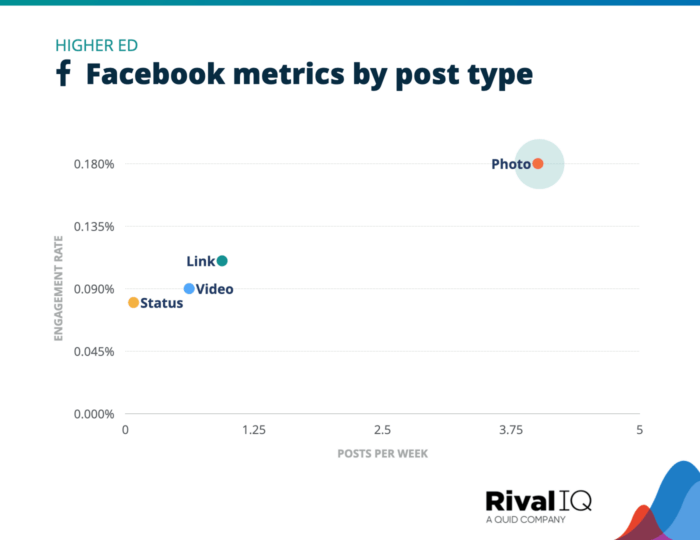
Schools and universities are active and engaging across all social media channels, and Facebook is no exception. The average Facebook engagement rate for schools and universities is 2.5 times as high as the all-industry rate and the posting frequency is a bit higher, too. We’ve also found that — you guessed it — photos are the most engaging and most frequently used post types for schools.
The University of Iowa is one of the top-performing schools on Facebook, according to our latest Higher Education Social Media Engagement Report. One of the school’s most successful Facebook posts this year received an incredible engagement rate of 20.4% which is over 129 times greater than the average Facebook engagement rate for schools and universities and nearly 324 times higher than the all-industry average.
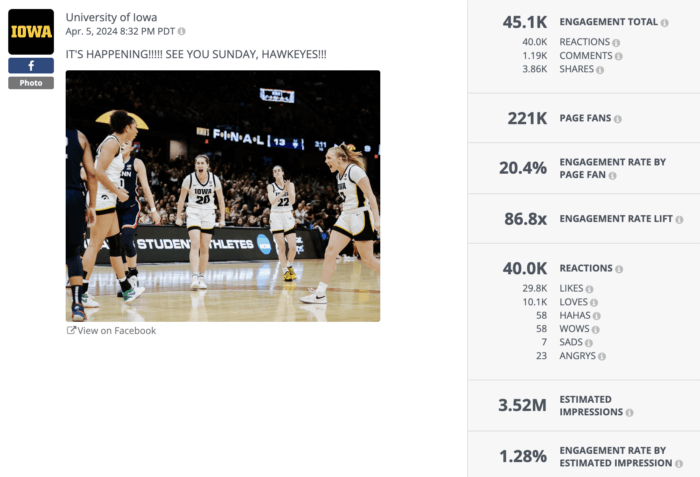
NCAA wins are *always* engaging, so it’s no surprise that this photo announcing the women’s basketball team going to the national championships earned killer engagement rates for the school.
While this post received high engagement because it’s centered around exciting news, there are still takeaways for any marketer. Whether or not you’re creating Facebook content for a university or sports team, take advantage of exciting milestones and moments your community wants to celebrate with you. And when you do, do so in a timely manner so you don’t miss the moment and can lean into the momentum of the news.
Morehouse College is another top college with an impressive engagement rate on Facebook. Morehouse’s posts this past year earned an average engagement rate of 0.77%, which is about five times greater than the overall rate on Facebook for higher education institutions.
One of the school’s most engaging Facebook posts broke out of the typical mold for the types of Facebook posts that usually earn schools high engagements like campus glamour shots or sports highlights. The post announced the exciting debut of Morehouse College freshman Saxton Moore Jr.’s first book, “Born Driven,” an uplifting story about the first African-American NASCAR champion Wendell Scott.
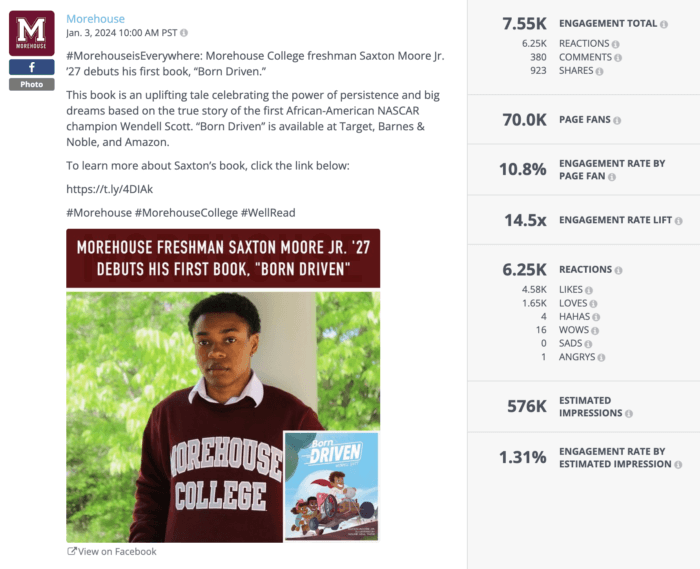
Generating 576K impressions and achieving a 10.8% engagement rate, the post was nearly 69 times more engaging than the average Facebook post by schools. The news clearly resonated with Morehouse’s audience — the comment section buzzed with excitement and pride and the post was shared more than 900 times.
Alcohol
- Alcohol Median Engagement Rate: 0.105%
- Alcohol Median Posting Frequency: 2.56 Facebook posts per week
Alcohol brands round out the top four industries with good engagement rates on Facebook. The median engagement rate for alcohol brands is about 1.67 times higher than the all-industry rate. The posting frequency is lower than the average at just under three times per week compared to the all-industry average of nearly five times per week.
Schell’s Brewery is one Alcohol brand that stands out on Facebook. Its posts from within the past year scored an average engagement rate of 0.53%, which is five times greater than the median rate for Alcohol brands. Schell’s also posts on Facebook at nearly double the rate of the average alcohol brand, sharing a little over four times per week.
One of its most engaging posts on Facebook is a photo album that served as a recap for the massive event that is Schell’s Brewery Oktoberfest. The “photo dump” included over 70 photos and highlighted the impressive numbers the event achieved.
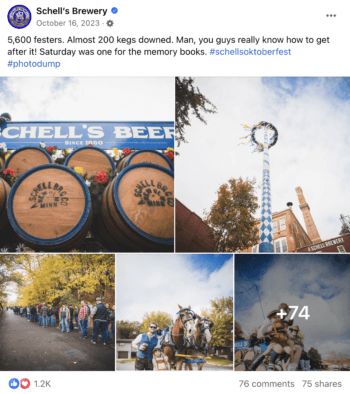
Schell’s shared a ton of promos for this event for months leading up to it, including a social media engagement contest that offered fans the chance to win Oktoberfest merch (and successfully earned a 7.44% engagement rate!).
And even though the photo album post didn’t come with the promise of some sweet swag, it also achieved a noteworthy engagement rate of 3.16%, which is a whopping 30 times higher than the average rate for alcohol brands and 50 times greater than the median engagement rate on Facebook.
It’s evident that the event is a big deal to them and their community, so it makes sense to share a recap in photo form. Whether its followers attended the event or not, an engaging photo album makes it possible for them to relive the fun or have something to look forward to the next year. Plus, sharing tons of event photos creates shareable content that will get connected back to you if someone were to share a photo of themselves from the album.
If you’ve been picking up on the pattern of what works well for brands on Facebook, it should come as no surprise that Photos were the most engaging and most used post type among Alcohol brands. This album that Schell’s shared aligns with the rest of the landscape’s success with using photos to engage with their audiences.
Aside from tapping into what’s working well for other similar brands and brands across industries, another takeaway is to create for your audience. Facebook content doesn’t need to be as polished or entertaining as other channels. In fact, your followers may view it as a source of information or to get updates on things like events or product launches. Lean into what’s working well and create content that meets your audience’s wants and needs.
The Wrap-Up
While 0.063% is considered a good engagement rate on Facebook, it should be viewed as a general baseline for your social media strategy. Different industries have their own median engagement rate to measure up against, so consider using social media benchmarking tools to determine how your brand stacks up against your competition before comparing it to the median rate across industries. This can help you set more realistic and achievable goals.
As evidenced by these brands, there’s no one-size-fits-all answer to achieving a good engagement rate on Facebook. Take note of what these top-performing posts are doing right, and experiment with how you can incorporate these best practices into your Facebook strategy. By continually testing and refining your approach, you’ll be able to discover what resonates best with your audience.
This post was originally published in December 2021 and has since been updated.