


15 Interactive Map Templates to Create National, Regional & Global Maps
A scatter plot is a great tool for visualizing the correlation between two variables and identifying patterns such as positive, negative or no correlation.
You can use a scatter plot to visualize essential data points, such as understanding how price changes affect sales, tracking employee performance trends and identifying the correlation between investments and results.
So how do you create one? While creating a scatter plot might initially seem daunting, it's actually a straightforward process. Setting up axes, adding labels, and understanding the significance of the dots are all manageable tasks.
However, it is crucial to use the right techniques and tools to achieve the desired results. In this article, we'll explain what a scatter plot is and share some handy tips, templates and even a guide to help you create one.
Let's get started!
A scatter plot is a type of data visualization that shows the relationship between different variables. This data is shown by placing various data points between the x- and y-axis.
Essentially, each of these data points looks “scattered” around the graph, giving this type of data visualization its name.
Scatter plots can also be known as scatter diagrams or x-y graphs. The point of using a scatter plot in data mining is to visualize the correlation between two continuous variables and identify patterns and trends in the data.
Take a look at this example of a scatter plot pulled from one of Visme’s templates.

The two variables are the square footage of a home versus its price. We pulled a sample data set of a couple handfuls of homes to see if we could determine a relationship between these two variables.
As the x-axis goes from the smallest size to the largest, we can see that there is a slight positive correlation showing that as square footage increases, so does the price.
Of course, there could be other factors contributing to this, like location or recent renovations, but we can see from this scatter diagram that there is a correlation between the square footage and home cost.
The patterns or correlations found within a scatter plot will have a few different features.
However, if you don't see any of these features present within your graph, that means there’s no correlation between your data.
Bubble charts are often confused for scatter plots because each data point is represented by a marker, such as a point or a bubble. Essentially, a bubble chart is a variation of a scatter plot.It includes an additional dimension represented by the size of the bubbles.
Besides the x values and y values that are plotted in a scatter diagram, a bubble chart plots x values, y values, and z (size) values.
Each type of chart or graph has its own rules for when it’s going to be the best data visualization to showcase your information.
Let’s dive into the best times to use a scatter plot to visualize your data set.
Are you trying to see if your two variables might mean something when put together? Plotting a scattergram with your data points can help you to determine whether there’s a potential relationship between them.
This is one of the key scatter plot uses, as it allows for data visualization to determine patterns or correlations, especially in scientific and business settings.
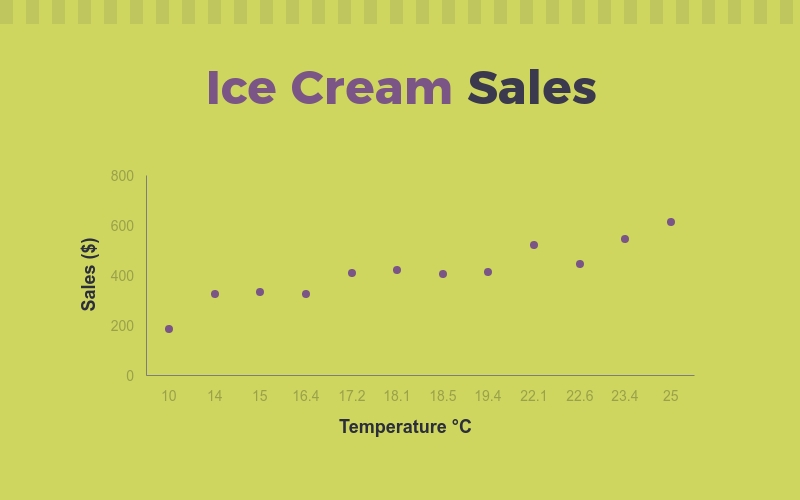
Let’s say you’re running an ice cream business, and you’re curious to see if there's a pattern in why your sales have been low recently.
You might create a scatter plot to measure different factors, including outside temperature.

You always want to plot your scatter diagram with both the x-axis and the y-axis increasing as they go out so that you can determine correlation.
As we can see in the above example, people tend to buy ice cream – a cold dessert – less often when the temperature is cold outside.
Okay, let’s take it back to math class for a minute and go over what independent and dependent variables mean.
First of all, a variable is the thing you’re trying to track or measure. Every graph has two variables – an independent variable that is typically graphed on the x-axis and a dependent variable that is typically graphed on the y-axis.
An independent variable is the controlled variable. This is what changes naturally, or what the person manipulating the experiment or graph changes.
A dependent variable is the variable that is being studied or measured. In the case of a scatter plot, it’s the variable that we’re looking to determine whether or not has a correlation with the independent variable.
If you’re trying to determine if height and weight have a correlation, the height will be placed on the x-axis and weight will be placed on the y-axis, like in the example below.

Because weight fluctuates much more than height, it’s likely that you could have different weights for the same height in your data, giving you more than one dependent variable value for each independent variable.
If you have two variables that pair well together, plotting them on a scatter diagram is a great way to view their relationship and see if it’s a positive or negative correlation.
For example, think about birth weight versus gestational age (how long the baby has been in utero). It would make sense that a baby who was able to grow inside its mother for longer would be larger, and therefore weigh more, correct?
Let’s take a look at this data on a scatter plot.

As we would expect, the longer a baby is able to “cook,” the more it tends to weigh at birth.
Other examples of variables that appear to go hand in hand would be hours worked versus money made, time studied versus test grade or price versus diamond size.
Just as there are certain times that it makes sense to use a scatter plot to visualize your data, there are a couple of examples when you want to stay away from this type of chart.
When it comes to using a scatter plot in data visualization, there are certain variables that make it obvious that there’s no correlation. Therefore, a scatter plot would be a useless way to visualize your information.
For example, if you’re gathering a random survey on a classroom full of students, putting together the students’ varying heights and the number of pets they have at home would make no sense on a scatter plot.
These two variables obviously have no relationship whatsoever, and while they can still be fun to graph, a bar chart (one for each data value) might be the better choice here.
When you have so much data in your scatter plot that it clogs up the entire graph, this is the result of overplotting.
Statistician Nathan Yau sums up this phenomenon pretty well in the below graphic:
As another example, take a look at the scatter plot below. It’s so dense that it essentially becomes one large blob, and it’s hard to read much from this kind of diagram.
There are a few ways to counteract an overplotted scatter plot, though. First, consider using a heatmap that shows where the most point-heavy sections of your data are.
You could also color code various data sets, use translucent data points to create a heatmap-like effect and more.
However, your best bet is to avoid using a scatter plot when you have so much data that it becomes a large blob.
Now, we’ll show you some examples of scatter plots that will help you understand their different components and how you can use them in various scenarios.

The percentage of profit scatter plot template is useful for displaying your company's profit margins through a scatter plot graph. If you are a financial expert who wants to analyze and report business performance quickly, then this template is perfect for you.
Examine the scatter plot and you'll notice that the profit percentage increases and fluctuates based on the budget. Using this template, you can analyze the key trends in your profit compared to your budget and make informed decisions to grow your business.

The ice cream sales scatter plot template is designed to help businesses track and analyze sales data effectively. It visually represents the relationship between temperature variations and ice cream sales, providing valuable insights into sales patterns.
It provides an excellent platform for visually presenting sales trends, making it easier to understand how external factors, such as temperature, impact sales. This allows you to make more informed business and marketing decisions.

A scatter plot is best used to display complex data like this: plastic production rate by year. It is an essential tool for researchers, environmental scientists, and policymakers seeking to understand global trends in plastic production.
Additionally, educators can use this template for classroom discussions, NGOs for advocacy reports and businesses for sustainability assessments and eco-friendly strategizing.
As you take a look at your data, there are a few things to keep in mind when you decide to use a scatter plot to determine relationships or correlation.
Just because you might see a strong positive or negative correlation in your data does not necessarily mean that your independent variable is the reason your dependent variable is measuring the way it is.
These are correlations, meaning that it appears that your independent variable does have some sort of effect on your dependent variable.
Let’s jump back into our ice cream sales example.
While it may seem that the weather is the direct cause of a decrease in sales, there could be so many other factors that are leading to slower business.
Perhaps there was a natural disaster like a hurricane that led to a mandatory evacuation and therefore less business. A new ice cream shop could have opened down the street creating competition that wasn’t there before.
Some days people just don’t want to buy ice cream. And while, sure, the colder weather might be a factor, just because you see a correlation on a scatter plot does not mean you should take it as law.

Your data set might include more than one dependent variable, and you can still track this on a scatter plot.
The only thing you’ll want to change is the color of each dependent variable so that you can measure them against each other on the scatter plot.
Let’s take a look back at our height versus weight example.
In that scatter plot, we added two different dependent variables – male and female – to see if there was also a difference between those factors. We colored female points orange and male points brown so that we could differentiate between the two.
This is another great way to avoid overplotting. Ensuring you’re color coding your data helps to set it apart so that you can see more of your points.
Now that you know all about what a scatter plot is and when you do and don’t want to use one, let’s get started with our tutorial on how you can actually create one.
There are 16 different chart types you can create right in Visme, and a scatter plot is only one of them! Learn more about how to get started below.
There are several different starter scatter plot templates available right in Visme for you to jump into and start adding your data.
Browse through our selection based on your scatter plot's purpose and click on the one you want to use. This will take you to the Visme dashboard with this template right inside so that you can immediately start customizing it to fit your needs.
Visme's suite of AI tools can simplify the design process for you. With these tools, you can effortlessly edit images, write content, create layouts, and even generate complete documents, charts, and presentations. All you need to do is provide simple prompts to these tools to explain your requirements, and they will do it for you.
Click on the scatter plot, and the graph settings will appear along the left side of your editor. Click Chart Data to input your data.
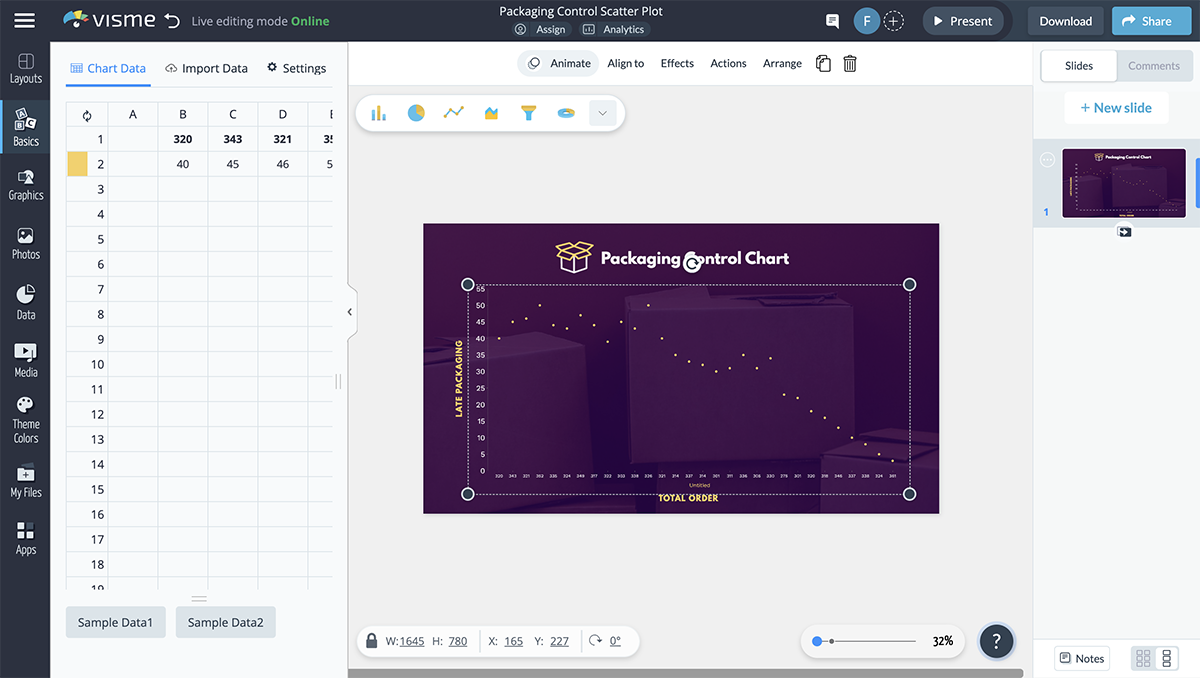
The x-axis information will go in the top row and the corresponding y-axis data will go in the bottom row. Be sure that all of your numbers on the x-axis are in numerical order from lowest to highest.
If you have more than one dependent variable, simply add that information to the next row for a second variable, the fourth row for a third and so on.
You can also head over to the Import Data tab to import data you’ve already gathered in a Google Sheet or Excel file.
Visme makes it easy to link your scatter plot with real-time data from various sources such as Google Sheets and MS Excel.
Connect your Sheets or Excel account with Visme and select your spreadsheet to import it into your charts and graphs. This will save you time and effort by eliminating manual data entry and ensuring you always have access to the latest data.
Head over to Settings, the third tab in the chart settings. Click to open the Axis tab. This is where you can customize your x- and y-axis information and ensure your scatter plot data is appearing correctly.

The first thing you need to do is ensure that Treat labels as text is switched to Off, otherwise your scatter plot will look a bit more like a line chart with dots.
Give each axis a label dictating what the variable is and customize your fonts to match the rest of your design by clicking the gear icon next to each axis. Or, as you see here, you can use separate text areas to label your graph.
Check out our article on font pairing to determine the best ones to use.
You can fully customize every single part of your scatter plot visualization in Visme’s editor. Choose a color for each of your dependent variable’s points, choose a color for your values, your axes and your chart title.

Click on the colored box next to each variable or each label in your settings to access the color picker. Choose from colors you’ve used in the past and preset palettes, or click on the + sign to access Visme’s color picker.
Once you find colors that make sense for your content or your overall design, you can move onto the next step.
To take your editing process to the next level, you can ask your teammates for feedback.
And guess what? With Visme’s collaborative design tool, you can invite anyone via email or a shareable link and allow them to comment, annotate and even edit the documents. This ensures that you receive the most accurate feedback from your team and keeps everyone on the same page.
Last but not least, animate your scatter diagram! Animation comes with any type of graph or chart within Visme’s editor.
This is a fun way to create interactive content if you’re embedding your scatter plot onto a webpage (like the one below) or sharing a link with your audience.
There are five different animation types for you to choose from for your chart: Linear, Bounce, Elastic, Ease Out and Ease In.

Once you’ve completed your changes, simply click outside of the chart on your canvas to download and share your scatter plot.
Visme gives you multiple options to share and publish your creations. You can download them in popular file formats like JPG, PNG and PDF for offline use. Or, you can share them on social media, share them using a link, or embed them on a web page through a code snippet generated in Visme.
Explore our comprehensive guide on 44 types of charts and graphs and choose the perfect one that best suits your needs.
Interpreting a scatter plot is about looking at the spread of dots on the graph to understand the relationship between two variables. When the points are closer to forming a line, it indicates a strong relationship between the variables. The slope of this line (whether upward or downward) indicates whether the relationship is positive or negative.
Additionally, a scatter plot can uncover data clusters or outliers that differ from the overall pattern.
The essential components of a scatter plot are:
Scatter plots visualize three things which are:
Here are some potential cons of using a scatter plot:
Now that you know what a scatter plot is and when and how to create one, it's time to create your own. Choose a scatter plot template from this article or browse through Visme's template library and customize it using Visme's graph maker.
Visme offers over 20 types of charts and graphs, including bar graphs, pie charts, bubble charts, and Venn diagrams. These visualizations can help you visualize complex data regardless of your use case or the complexity of the data.
The best part is that you don't need any data visualization skills or experience to create these visualizations. Visme's drag-and-drop editor makes the design process easy and intuitive.
So, what are you waiting for? Sign up for a free account in Visme and start creating professional-grade visualizations.
Design visual brand experiences for your business whether you are a seasoned designer or a total novice.
Try Visme for free

About the Author
Chloe West is the content marketing manager at Visme. Her experience in digital marketing includes everything from social media, blogging, email marketing to graphic design, strategy creation and implementation, and more. During her spare time, she enjoys exploring her home city of Charleston with her son.