


Observational studies show an association between ferritin and type 2 diabetes (T2D), suggesting a role of high iron stores in T2D development. However, ferritin is influenced by factors other than iron stores, which is less the case for other biomarkers of iron metabolism. We investigated associations of ferritin, transferrin saturation (TSAT), serum iron, and transferrin with T2D incidence to clarify the role of iron in the pathogenesis of T2D.
The European Prospective Investigation into Cancer and Nutrition–InterAct study includes 12,403 incident T2D cases and a representative subcohort of 16,154 individuals from a European cohort with 3.99 million person-years of follow-up. We studied the prospective association of ferritin, TSAT, serum iron, and transferrin with incident T2D in 11,052 cases and a random subcohort of 15,182 individuals and assessed whether these associations differed by subgroups of the population.
Higher levels of ferritin and transferrin were associated with a higher risk of T2D (hazard ratio [HR] [95% CI] in men and women, respectively: 1.07 [1.01–1.12] and 1.12 [1.05–1.19] per 100 μg/L higher ferritin level; 1.11 [1.00–1.24] and 1.22 [1.12–1.33] per 0.5 g/L higher transferrin level) after adjustment for age, center, BMI, physical activity, smoking status, education, hs-CRP, alanine aminotransferase, and γ-glutamyl transferase. Elevated TSAT (≥45% vs. <45%) was associated with a lower risk of T2D in women (0.68 [0.54–0.86]) but was not statistically significantly associated in men (0.90 [0.75–1.08]). Serum iron was not associated with T2D. The association of ferritin with T2D was stronger among leaner individuals (Pinteraction < 0.01).
The pattern of association of TSAT and transferrin with T2D suggests that the underlying relationship between iron stores and T2D is more complex than the simple link suggested by the association of ferritin with T2D.
Introduction
Hereditary hemochromatosis (HHC), a genetic disorder characterized by systemic iron overload, is reported to be associated with diabetes (1). Similarly, an overrepresentation of diabetes cases has also been described among individuals with conditions of acquired iron overload, such as thalassemia major (2). This raises the question whether high levels of body iron are a risk factor for type 2 diabetes in the general population; this would have implications for the prevention and treatment of type 2 diabetes. Cross-sectional and prospective population studies report a positive association between ferritin and type 2 diabetes (3,4). However, although ferritin is considered a marker of iron stores in healthy individuals (5–7), it is also an acute phase reactant and is influenced by inflammation, liver disease, and insulin resistance, which are also associated with type 2 diabetes (8–11).
Other commonly measured biomarkers of iron metabolism reflect different aspects of the process and are less influenced by the above-mentioned conditions; therefore, their use may provide additional information on the role of iron in the pathogenesis of type 2 diabetes. Transferrin is the iron-binding protein in circulation, and its levels rise with increasing iron requirements. Serum iron is difficult to interpret in isolation because it has a diurnal variation and hence varies significantly without changes in total body iron (12). Transferrin saturation (TSAT) is the proportion of transferrin bound to serum iron and is in part a marker of iron absorption: it reflects the proportion of circulating iron in the context of iron requirements. TSAT is elevated in the presence of non-transferrin-bound iron, which in turn is responsible for iron-related oxidative damage (13,14).
We investigated the association of ferritin, TSAT, serum iron, and transferrin with incident type 2 diabetes in a large, prospective European case-cohort study. We also assessed whether these associations have a threshold effect or differ by subgroups of the population, such as individuals not presenting signs of conditions commonly associated with hyperferritinemia.
Research Design and Methods
The EPIC-InterAct Study
Participants and Study Design
The InterAct study is a large case-cohort study of incident type 2 diabetes and is nested within the European Prospective Investigation into Cancer and Nutrition (EPIC) study, the design and population characteristics of which have been published previously (15). In brief, a total of 12,403 incident cases of type 2 diabetes were ascertained and verified during 3.99 million person-years of follow-up (mean follow-up, 11.7 years) of 340,234 eligible EPIC participants (men and women, age 20–80 years at baseline, who had a stored blood sample and a reported diabetes status). The subcohort (n = 16,154), which was a representative sample of the original cohort, was identified by randomly selecting individuals from each center. We excluded individuals who had prevalent clinically diagnosed diabetes at baseline. By design, there are individuals with incident diabetes who were also randomly allocated to the subcohort (n = 778), and these are included as cases in case-cohort analyses (15). A detailed breakdown of participants with data on the iron biomarkers and covariates are detailed in results. Participants gave written informed consent, and the study was approved by the local ethics committee in the participating countries and the internal review board of the International Agency for Research on Cancer.
Measurements
Standardized information was collected by questionnaire and physical examination at recruitment as part of EPIC. Participants were asked about their level of education, smoking status, and alcohol consumption (which was subsequently converted into mean grams/day). Diet and physical activity were assessed using questionnaires (15,16). Most cohorts were asked about the presence of a family history of type 2 diabetes, defined as type 2 diabetes in a first-degree relative, except those in Italy, Spain, Oxford, and Heidelberg. Menopausal status was defined as menopausal (postmenopausal or postoophorectomy) and nonmenopausal (pre- or perimenopausal). A blood sample was taken at varying times of day and stored frozen for future measurements (15). Follow-up data on mortality and disease status was ascertained via registries, clinical records, and other sources of clinical information (15).
Type 2 Diabetes Case Ascertainment and Verification
Incident type 2 diabetes cases were identified using multiple sources of evidence, including self-report, linkage to primary-care registers, linkage to secondary-care registers, medication use, hospital admissions, and mortality data. Cases were considered verified if confirmed by at least two independent sources. Cases in Denmark and Sweden were identified via local and national diabetes and pharmaceutical registers, and hence all ascertained cases were considered to be verified (15). Follow-up was censored at the date of diagnosis, 31 December 2007, or date of death, whichever occurred first.
Laboratory Measurements
Serum samples were used to measure the biomarkers in all centers except Umea (n = 1,845), where only plasma samples were available and only ferritin could be measured. All measurements were done at the Stichting Huisartsen Laboratorium, Etten-Leur, the Netherlands. Cobas assays were used to measure ferritin (electrochemiluminescence immunoassay sandwich principle), iron (colorimetric assay), and transferrin (immunoturbidimetric assay) on a Roche Hitachi Modular P analyzer. The assay range for serum iron was 0.9–179 μmol/L, that for transferrin was 1.26–63 μmol/L, and that for ferritin was 0.5–2000 μg/L. Results below the lower detection limit for each assay were considered missing (only two results for serum iron). TSAT was calculated as follows: [iron (μmol/L) × 100)]/[transferrin (g/L) × 22.75]. Cobas assays on the same analyzer were also used to measure hs-CRP (particle-enhanced immunoturbidimetric assay), alanine aminotransferase (ALT) and aspartate aminotransferase (AST) (ultraviolet test), and γ-glutamyl transferase (GGT) (enzymatic calorimetric assay). Quality control was based on the Westgard rules (17).
Statistical Analysis
Baseline characteristics of individuals in the subcohort were compared across sex-specific quartiles of ferritin distribution. Distributions of ferritin levels were compared by sex, BMI, and waist circumference categories in the subcohort. After log-transformation of variables with skewed distributions (ferritin, hs-CRP, GGT, and alcohol consumption), a multivariable regression model adjusted for age, center, and sex, and unadjusted Pearson correlation coefficients, were used to describe the relationships between each biomarker of iron metabolism and each other, and with possible confounders.
We estimated associations of differences (defined in Table 3) in ferritin, iron, and transferrin (in natural units) with the risk of type 2 diabetes using Prentice-weighted Cox regression models with age as the underlying timescale, fitted separately within each country; estimates were combined across countries using random effects meta-analysis. Prentice-weighted Cox regression is used to analyze a case-cohort study to account for the enrichment of incident cases occurring outside of the random subcohort. We used hazard ratios (HRs) as estimates of risk. We used TSAT ≥45% as a cutoff because this is the threshold recommended by clinical guidelines to rule out genetic causes of hyperferritinemia (18) and at which substantial levels of non-transferrin-bound iron appear (14). We fitted three different models with increasing levels of adjustment for key potential confounders, namely, age, study center, BMI, physical activity, smoking status, level of education, hs-CRP, ALT, and GGT. AST and ALT were highly correlated (r = 0.75), and because AST is less specific for liver disease than ALT, we included only ALT in the model. We included participants who had data available for the relevant biomarker and all these potential confounders, unless stated otherwise. To compare results with pooled estimates from a recent meta-analysis (3), results were also reported for the top quintile compared with the lowest quintile of ferritin (sex-specific quintiles defined in the subcohort). Because the distribution of ferritin is substantially different among men and women in the general population, we also reported results for one sex-specific SD of ferritin. We also presented HRs for various TSAT cutoffs and for a 5% higher level of TSAT. Adjusted and unadjusted cubic splines were generated for the association of each biomarker with type 2 diabetes in men and women. The splines were calculated between the 1st and 99th percentiles of the relevant biomarker, with knots at the 5th, 25th, 75th, and 95th percentiles and the median as the reference.
The association of ferritin with type 2 diabetes was also estimated in a restricted sample of individuals who did not present signs of common correlates of hyperferritinemia, namely, inflammation, liver disease, high alcohol consumption, and obesity (n = 10,958). These were defined as individuals with hs-CRP <10 mg/L, ALT and AST ≤40 U/L, GGT ≤60 U/L (men) and ≤40 U/L (women) and low to moderate self-reported alcohol consumption (<30 g/day in men and <20 g/day in women, as suggested by the European Association for the Study of Liver [19]). The same association was also estimated after excluding individuals with ferritin levels higher than 1,000 μg/L (n = 125) in an attempt to exclude individuals with conditions of extreme iron overload, such as HHC.
For biomarkers that showed a significant association with type 2 diabetes in men and women, P values for interaction between the biomarker and variables related to iron metabolism were estimated by including a parameter representing the interaction between the biomarker (continuous) and the variable of interest (categorical) in Prentice-weighted Cox regression models adjusted for age, sex, and center and fitted within each country; estimates were combined using random effects meta-analysis. HRs of type 2 diabetes for each biomarker were then estimated within strata for each variable of interest. Waist circumference was categorized according to sex-specific cutoffs (20) and BMI according to the World Health Organization classification (defined in Fig. 2).
Sensitivity analyses were carried out for the association of ferritin and type 2 diabetes because it is the one where confounding is most likely; this was also adjusted for menopausal status, alcohol consumption, and red meat consumption. Information on waist circumference and family history of type 2 diabetes was missing in 7.3% and 50.4% of the study population, respectively, mainly because it had not been assessed by certain centers. Therefore, these variables were not included as covariates in the main models, but sensitivity analyses were carried out among individuals with information on waist circumference (n = 23,122) and family history of type 2 diabetes (n = 11,565). All analyses were performed using Stata 13.
Results
Of all 27,779 InterAct participants (12,403 incident type 2 diabetes cases), between 23,554 (10,371 cases) and 25,113 individuals (11,052 cases) had data available for the relevant biomarkers and all the covariates for the main models and were included in this analysis. The median (interquartile range) of ferritin in the subcohort was 144 μg/L (80–241 μg/L) in men and 58 μg/L (29–107 μg/L) in women. Among those in the subcohort, 8.31% of men and 4.78% of women had TSAT ≥45%. Summary statistics of biomarkers and baseline characteristics of participants by quartiles of ferritin in the subcohort are detailed in Tables 1 and 2. Individuals in the highest quartile of ferritin were older, consumed more alcohol, had lower levels of transferrin, and had higher levels of TSAT and liver enzymes compared with individuals in the rest of the subcohort. Leaner individuals had smaller SDs of ferritin (Supplementary Table 1). In linear regression analyses adjusting for age, sex, and center (Supplementary Table 2), ferritin was associated with each of the other iron markers and with all of the possible confounding factors with the exception of estimated dietary iron intake, for which the relationship was weak. TSAT was strongly correlated with serum iron (r = 0.91) and inversely correlated with hs-CRP (r = −0.15). Estimated dietary iron intake was only weakly associated with ferritin and not with the other iron biomarkers.
Baseline characteristics by quartiles of ferritin in men in the subcohort (n = 5,697)
| Ferritin by quartile* (μg/L) | P for difference across quartiles† | Ferritin in the overall subcohort (μg/L) | ||||
|---|---|---|---|---|---|---|
| Q1 (4–80) | Q2 (81–144) | Q3 (145–241) | Q4 (242–2283) | |||
| Age (years) | 52.2 (8.9) | 52.1 (9.1) | 52.8 (9.1) | 53.5 (8.3) | <0.001 | 52.9 (8.9) |
| BMI (kg/m2) | 26.2 (3.5) | 26.4 (3.5) | 26.6 (3.5) | 27.4 (3.6) | <0.001 | 26.6 (3.6) |
| Education | 0.0001 | |||||
| Low | 7.9 | 6.1 | 4.9 | 4.4 | 5.6 | |
| Primary | 37.0 | 35.0 | 31.5 | 32.0 | 34.1 | |
| Vocational | 21.4 | 21.4 | 22.7 | 25.3 | 22.8 | |
| Secondary | 13.2 | 13.3 | 13.7 | 12.3 | 13.3 | |
| Higher | 20.5 | 24.1 | 27.2 | 26.1 | 24.2 | |
| Physical activity | 0.006 | |||||
| Inactive | 17.5 | 17.8 | 19.7 | 18.9 | 18.7 | |
| Moderately inactive | 28.6 | 29.9 | 30.7 | 34.0 | 30.9 | |
| Moderately active | 25.9 | 27.1 | 24.2 | 24.8 | 25.5 | |
| Active | 28.0 | 25.1 | 25.2 | 22.3 | 24.9 | |
| Smoking | 0.7 | |||||
| Never | 34.5 | 32.8 | 30.6 | 29.2 | 31.7 | |
| Former | 32.5 | 32.5 | 37.7 | 42.6 | 36.7 | |
| Current | 33.0 | 34.7 | 31.6 | 28.2 | 31.6 | |
| Family history of type 2 diabetes | 12.1 | 16.2 | 12.8 | 19.3 | <0.001 | 15.5 |
| Alcohol intake (g/day)‡ | 10.5 (2.2–24.6) | 12.3 (3.4–28.3) | 15.2 (5.4–36.2) | 19.3 (7.1–40.2) | <0.001 | 13.5 (4.0–32.4) |
| Dietary iron intake (mg/day) | 15.3 (4.9) | 15.4 (5.0) | 15.2 (5.0) | 15.3 (5.0) | 0.9 | 15.3 (5.0) |
| Biomarkers | ||||||
| TSAT (%) | 26.8 (9.9) | 29.7 (9.8) | 30.8 (9.2) | 33.8 (12.5) | <0.001 | 30.3 (10.7) |
| Iron (μmol/L) | 17.3 (6.0) | 17.8 (5.7) | 18.2 (5.5) | 19.2 (6.6) | <0.001 | 18.1 (6.0) |
| Transferrin (g/L) | 2.9 (0.4) | 2.7 (0.4) | 2.6 (0.3) | 2.5 (0.4) | <0.001 | 2.7 (0.4) |
| Glucose (mmol/L) | 5.0 (1.6) | 5.1 (1.3) | 5.2 (1.5) | 5.6 (1.5) | <0.001 | 5.2 (1.5) |
| HbA1c (mmol/mol) | 36.4 (4.8) | 36.3 (4.5) | 36.4 (5.4) | 36.3 (6.4) | 0.97 | 36.4 (5.3) |
| hs-CRP (mg/L)‡ | 0.9 (0.5–1.9) | 1.0 (0.5–2.1) | 1.1 (0.6–2.5) | 1.4 (0.7–2.9) | <0.001 | 1.1 (0.5–2.3) |
| ALT (U/L) | 22.6 (10.4) | 24.4 (11.8) | 26.6 (13.6) | 32.9 (20.0) | <0.001 | 26.6 (14.9) |
| AST (U/L) | 29.3 (7.6) | 30.0 (8.4) | 30.9 (9.5) | 35.0 (15.3) | <0.001 | 31.3 (10.9) |
| GGT (U/L)‡ | 24.0 (18.0–34.0) | 26.0 (19.0–40.0) | 29.5 (21.0–46.0) | 36.0 (25.0–60.0) | <0.001 | 28.0 (20.0–44.0) |
Data are mean (SD) or percentage. Data for skewed variables (marked with a ‡) are shown as median (interquartile range).
*Range of ferritin values by quartile are in parentheses.
†ANOVA for normally distributed continuous variables, Kruskal-Wallis test for continuous variables with skewed distribution (marked with a ‡), and χ2 test for categorical variables.
Baseline characteristics by quartiles of ferritin in women in the subcohort (n = 9,485)
| Ferritin by quartile* (μg/L) | P for difference across quartiles† | Ferritin in the overall subcohort (μg/L) | ||||
|---|---|---|---|---|---|---|
| Q1 (1–29) | Q2 (30–58) | Q3 (59–107) | Q4 (108–3,017) | |||
| Age (years) | 47.2 (8.0) | 50.0 (9.4) | 54.1 (8.7) | 57.0 (7.8) | <0.001 | 52.1 (9.3) |
| BMI (kg/m2) | 25.5 (4.4) | 25.4 (4.6) | 25.4 (4.4) | 26.4 (4.6) | <0.001 | 25.7 (4.5) |
| Education | 0.002 | |||||
| Low | 12.4 | 10.2 | 7.3 | 6.3 | 8.9 | |
| Primary | 33.1 | 30.5 | 32.6 | 34.2 | 32.8 | |
| Vocational | 20.3 | 22.0 | 24.4 | 26.6 | 23.4 | |
| Secondary | 15.6 | 16.6 | 18.0 | 17.0 | 16.6 | |
| Higher | 18.6 | 20.7 | 17.8 | 15.9 | 18.3 | |
| Physical activity | 0.0008 | |||||
| Inactive | 30.1 | 26.4 | 26.8 | 24.5 | 27.0 | |
| Moderately inactive | 34.2 | 35.4 | 34.8 | 36.2 | 35.1 | |
| Moderately active | 20.3 | 20.9 | 20.4 | 21.1 | 20.9 | |
| Active | 15.4 | 17.3 | 18.0 | 18.2 | 17.1 | |
| Smoking | 0.0006 | |||||
| Never | 59.7 | 54.6 | 54.1 | 56.2 | 56.0 | |
| Former | 20.2 | 21.3 | 21.7 | 22.4 | 21.4 | |
| Current | 20.1 | 24.1 | 24.3 | 21.4 | 22.6 | |
| Family history of type 2 diabetes | 19.7 | 18.7 | 19.5 | 23.5 | 0.1 | 20.5 |
| Alcohol intake (g/day)‡ | 1.7 (0–7.2) | 2.7 (0.2–10.6) | 3.6 (0.4–12.0) | 5.1 (0.6–13.5) | <0.001 | 3.0 (0.2–11.1) |
| Estimated dietary iron intake (mg/day) | 12.3 (3.6) | 12.4 (3.7) | 12.3 (3.6) | 12.0 (3.4) | 0.009 | 12.2 (3.6) |
| Biomarkers | ||||||
| TSAT (%) | 20.8 (10.5) | 27.2 (9.7) | 28.5 (9.0) | 30.5 (10.3) | <0.001 | 26.7 (10.5) |
| Iron (μmol/L) | 14.3 (6.7) | 17.1 (6.0) | 17.3 (5.4) | 17.8 (5.8) | <0.001 | 16.6 (6.2) |
| Transferrin (g/L) | 3.1 (0.5) | 2.8 (0.4) | 2.7 (0.4) | 2.6 (0.4) | <0.001 | 2.8 (0.4) |
| Glucose (mmol/L) | 4.7 (1.3) | 4.7 (1.0) | 4.8 (1.2) | 5.0 (1.3) | <0.001 | 4.8 (1.2) |
| HbA1c (mmol/mol) | 35.6 (4.6) | 35.5 (4.3) | 36.4 (4.7) | 36.9 (5.8) | <0.001 | 36.1 (4.9) |
| hs-CRP (mg/L)‡ | 0.9 (0.4–1.9) | 1.0 (0.5–2.2) | 1.1 (0.6–2.5) | 1.4 (0.7–3.1) | <0.001 | 1.1 (0.5–2.4) |
| ALT (U/L) | 17.0 (8.7) | 17.7 (9.0) | 19.5 (12.4) | 21.9 (15.1) | <0.001 | 19.0 (11.7) |
| AST (U/L) | 25.7 (9.9) | 26.1 (10.1) | 27.3 (7.9) | 29.1 (13.7) | <0.001 | 27.1 (10.7) |
| GGT (U/L)‡ | 14.0 (11.0–18.0) | 16.0 (12.0–22.0) | 18.0 (14.0–26.0) | 20.0 (15.0–31.0) | <0.001 | 17.0 (13.0–24.0) |
Data are mean (SD) or percentages. Data for skewed variables (marked with a ‡) are median (interquartile range).
*Range of ferritin values by quartile are in parentheses.
†ANOVA for normally distributed continuous variables, Kruskal-Wallis test for continuous variables with skewed distribution (marked with a ‡), and χ2 test for categorical variables.
HRs of type 2 diabetes for each biomarker are summarized in Table 3 and Supplementary Fig. 1; the adjusted and unadjusted associations estimated from spline regression are displayed in Fig. 1 and Supplementary Fig. 2, respectively. A 100 μg/L higher ferritin level was associated with a higher risk (95% CI) of type 2 diabetes in men (1.07 [1.01–1.12]) and women (1.12 [1.05–1.19]), after adjustment for age, center, BMI, physical activity, smoking status, level of education, hs-CRP, ALT, and GGT. HRs per sex-specific SD of ferritin were similar in men and women (Supplementary Table 3). The spline analyses showed that the strengths of the associations were weakened by the adjustment (particularly for ferritin), whereas the shapes of the associations remained generally similar. TSAT ≥45% versus <45% was associated with a significantly lower risk of type 2 diabetes in women only. Using cutoffs of 50% and 55% for TSAT or estimating HRs per 5% higher level of TSAT did not substantially affect the results, but the association was no longer statistically significant in women using cutoffs of 50% or 55% (Supplementary Table 4). A higher serum iron level was not associated with type 2 diabetes. A higher transferrin level was associated with a higher risk of type 2 diabetes in men (1.11 [1.00–1.24]) and women (1.22 [1.12–1.33]). The associations of ferritin and transferrin with type 2 diabetes were most attenuated after adjustment for BMI and ALT (data not shown). Sensitivity analyses excluding individuals who developed diabetes within the first 2 years of follow-up did not change the results (data not shown).
HRs (95% CI) of type 2 diabetes for the higher biomarker levels stated, by sex and meta-analyzed across countries
| Biomarkers by sex | HR (95% CI) | P value | Heterogeneity I2 (%) |
|---|---|---|---|
| Men | |||
| Ferritin (per 100 μg/L) | |||
| Model 1 | 1.18 (1.12–1.25) | <0.001 | |
| Model 2 | 1.13 (1.08–1.19) | <0.001 | |
| Model 3 | 1.06 (1.01–1.12) | 0.021 | 72.20 |
| TSAT ≥45% | |||
| Model 1 | 0.99 (0.81–1.20) | 0.885 | |
| Model 2 | 1.06 (0.86–1.32) | 0.579 | |
| Model 3 | 0.90 (0.75–1.08) | 0.259 | 0.0 |
| Serum iron (per 5 μmol/L) | |||
| Model 1 | 1.03 (0.98–1.08) | 0.293 | |
| Model 2 | 1.04 (0.98–1.11) | 0.166 | |
| Model 3 | 1.00 (0.94–1.07) | 0.976 | 49.40 |
| Transferrin (per 0.5 g/L) | |||
| Model 1 | 1.20 (1.12–1.30) | <0.001 | |
| Model 2 | 1.16 (1.05–1.29) | 0.003 | |
| Model 3 | 1.11 (1.00–1.23) | 0.061 | 54.50 |
| Women | |||
| Ferritin (per 100 μg/L) | |||
| Model 1 | 1.31 (1.22–1.41) | <0.001 | |
| Model 2 | 1.22 (1.14–1.31) | <0.001 | |
| Model 3 | 1.12 (1.05–1.19) | 0.001 | 53.50 |
| TSAT ≥45% | |||
| Model 1 | 0.54 (0.44–0.67) | <0.001 | |
| Model 2 | 0.73 (0.59–0.91) | 0.004 | |
| Model 3 | 0.68 (0.54–0.86) | 0.002 | 0.0 |
| Serum iron (per 5 μmol/L) | |||
| Model 1 | 0.92 (0.89–0.95) | <0.001 | |
| Model 2 | 1.02 (0.97–1.07) | 0.403 | |
| Model 3 | 1.00 (0.95–1.05) | 0.869 | 38.00 |
| Transferrin (per 0.5 g/L) | |||
| Model 1 | 1.30 (1.21–1.41) | <0.001 | |
| Model 2 | 1.24 (1.15–1.34) | <0.001 | |
| Model 3 | 1.22 (1.12–1.33) | <0.001 | 55.30 |
| Men and women | |||
| Ferritin (upper vs. lower quintile)† | |||
| Model 1* | 2.46 (2.05–2.96) | <0.001 | |
| Model 2* | 1.77 (1.57–2.00) | <0.001 | |
| Model 3* | 1.36 (1.20–1.54) | <0.001 | 5.3 |
Model 1 is adjusted for age and center. Model 2 is further adjusted for BMI, physical activity, smoking status, and level of education. Model 3 is adjusted even further for hs-CRP, ALT, and GGT.
*Additional adjustment for sex.
†Ferritin quintile cut points for men: ≤68, >68–117, >117–177, >177–270, and >270 μg/L; for women: ≤24, >24–45, >45–73, >73–121, and >121 μg/L.

Adjusted HRs for type 2 diabetes by ferritin, TSAT, serum iron and transferrin levels in men and women. Ferritin in men (A) and women (B); TSAT in men (C) and women (D); serum iron in men (E) and women (F); and transferrin in men (G) and women (H). Adjusted for age, BMI, physical activity, smoking status, level of education, hs-CRP, ALT, and GGT (A–F and H) and age, BMI, hs-CRP, ALT, and GGT only (G) because otherwise the spline failed to converge. The histograms represent the distribution of the biomarkers in the given population.
Adjusted HRs for type 2 diabetes by ferritin, TSAT, serum iron and transferrin levels in men and women. Ferritin in men (A) and women (B); TSAT in men (C) and women (D); serum iron in men (E) and women (F); and transferrin in men (G) and women (H). Adjusted for age, BMI, physical activity, smoking status, level of education, hs-CRP, ALT, and GGT (A–F and H) and age, BMI, hs-CRP, ALT, and GGT only (G) because otherwise the spline failed to converge. The histograms represent the distribution of the biomarkers in the given population.
Restricting the analyses to individuals not presenting any sign of overt inflammation, liver disease, high alcohol consumption, or obesity moderately weakened the association of ferritin with type 2 diabetes in men to an HR (95% CI) of 1.04 (0.96–1.12), whereas the association remained similar in women, with an HR of 1.12 (1.02–1.24) per 100 μg/L higher level of ferritin, adjusted for age, center, type 2 diabetes risk factors, hs-CRP, and liver enzymes. Among individuals with ferritin levels <1,000 μg/L, the association of ferritin with type 2 diabetes was similar in men, with an HR of 1.09 (1.02–1.15), but higher in women (1.26 [1.15–1.38]).
In age- and center-adjusted analyses, associations for ferritin, TSAT, serum iron, and transferrin were stronger among women compared with men, although differences did not reach conventional levels of statistical significance for transferrin (Pinteraction = 0.004, <0.001, 0.01, and 0.47, respectively). There was a stronger association of ferritin with type 2 diabetes among leaner individuals (Fig. 2), with a significant interaction with waist circumference (Pinteraction = 0.004) and BMI (Pinteraction < 0.001). Transferrin showed a stronger association with type 2 diabetes among individuals at extremes of waist circumference (Pinteraction = 0.034). There was no interaction of either ferritin or transferrin with menopausal status, estimated dietary iron, or alcohol consumption, and no interaction of transferrin with BMI.
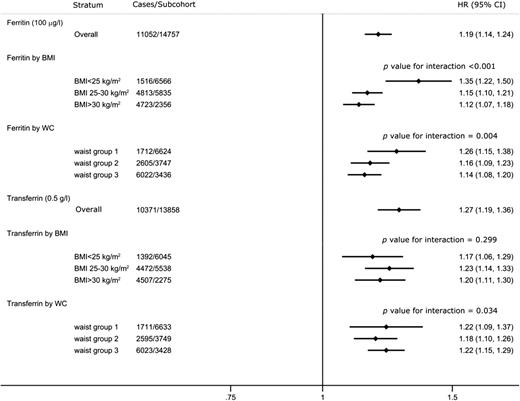
HRs of type 2 diabetes per 100 μg/L of ferritin and 0.5 g/L of transferrin in men and women by strata adjusting for age, sex, and center, and meta-analyzed across countries. Waist circumference (WC) in men: group 1, <94 cm; group 2, 94–102 cm; group 3, ≥102 cm; in women: group 1, <80 cm; group 2, 80–88 cm; group 3, ≥88 cm.
HRs of type 2 diabetes per 100 μg/L of ferritin and 0.5 g/L of transferrin in men and women by strata adjusting for age, sex, and center, and meta-analyzed across countries. Waist circumference (WC) in men: group 1, <94 cm; group 2, 94–102 cm; group 3, ≥102 cm; in women: group 1, <80 cm; group 2, 80–88 cm; group 3, ≥88 cm.
Adjusting for menopausal status, alcohol consumption, red meat intake, family history of type 2 diabetes, or waist circumference did not substantially modify the association of ferritin among men or women (Supplementary Table 5).
Conclusions
This study, which was conducted in a large European population, showed that higher ferritin and transferrin levels were associated with an increased risk of type 2 diabetes among men and women. Even among individuals showing no signs of overt inflammation, liver disease, high alcohol consumption, or obesity, ferritin was associated with type 2 diabetes in women and to a lesser extent in men. An elevated TSAT was associated with a lower risk of type 2 diabetes in women when a cutoff of 45% was used, and serum iron was not associated with type 2 diabetes. The associations of all four iron biomarkers with type 2 diabetes were stronger among women than men. This likely reflects physiological differences in iron metabolism and biomarker distributions between men and women, causing the relative risk of absolute biomarker differences to be greater in women.
The association of ferritin with type 2 diabetes has previously been reported, but the association from the latest meta-analysis of prospective studies was stronger and less precise than that found in this study, with an HR (95% CI) of 1.73 (1.35–2.22) for the top quintile compared with the lower quintile in the meta-analysis (3). This difference may be explained by the much larger number of cases in this study (11,052 versus 3,391) and the lack of adjustment for liver enzymes in many of the studies included in the meta-analysis. The stronger association among women than men using natural units was no longer apparent when using standardized units, suggesting that the stronger association is a reflection of the different distributions of ferritin among men and women in the population. Contrary to suggestions from previous studies (21,22), we did not observe a threshold effect of ferritin with incident type 2 diabetes in the InterAct study, but rather a linear association, with an increased risk even at levels of ferritin considered within the reference range. To our knowledge, we demonstrated for the first time that ferritin showed a relatively stronger association among leaner individuals. This may be because leaner individuals have a lower absolute risk of type 2 diabetes and that the SD of ferritin is smaller among leaner individuals, and hence the relative risk of ferritin is larger in leaner than in overweight or obese individuals. The association of higher transferrin with type 2 diabetes was previously reported in a small prospective study, which also showed the absence of an association of serum iron with type 2 diabetes (23).
Nevertheless, our study found a more complex relationship between TSAT and diabetes. Results from existing prospective studies of TSAT with type 2 diabetes are conflicting. A study using data from the National Health and Nutrition Examination Survey did not find any association between TSAT and type 2 diabetes using different cutoffs for TSAT (24). By contrast, a meta-analysis of three Danish studies found that TSAT ≥50% was associated with a higher risk of type 2 diabetes (25). However, these were relatively small studies, with fewer than 1,500 cases in each. This is, to our knowledge, the first prospective study to show that elevated TSAT is associated with a lower risk of type 2 diabetes, which was statistically significant only in women. Recent cross-sectional studies have shown a similar association of high ferritin and low TSAT among individuals with “prediabetes” (26–28). TSAT is a useful biomarker of iron metabolism in addition to ferritin (26) because TSAT levels are less affected by inflammation than ferritin (29) and are thought to reflect levels of non-transferrin-bound iron (13,14). In patients with HHC, which is characterized by high iron absorption, TSAT is elevated first, followed by ferritin once iron accumulates in tissues (1). Non-transferrin-bound iron is thought to be an important source of organ iron deposition and toxicity because it is avidly taken up by tissues, independent of the transferrin receptor (14), and levels have been shown to be higher in patients with type 2 diabetes compared with controls (30). However, the direction of association between TSAT and type 2 diabetes observed in this study does not support a simple association between increased iron absorption or higher non-transferrin-bound iron and type 2 diabetes. This may be because not all cases of iron overload are characterized by elevated TSAT. For example, the insulin resistance–associated hepatic iron overload syndrome is characterized by mild to moderate hepatic iron overload on liver biopsy, generally with elevated ferritin but normal TSAT (31–33). Alternatively, a higher TSAT could reflect more successful scavenging of non-transferrin-bound iron and therefore be protective against type 2 diabetes. Finally, because TSAT is inversely associated with inflammation, negative confounding by inflammation may mask an association of TSAT with type 2 diabetes.
High levels of ferritin and transferrin are markers of high and low iron stores, respectively, and were strongly inversely correlated. However, they were both positively associated with type 2 diabetes in this study. Participants with low ferritin levels had a lower risk of developing type 2 diabetes compared with the median, suggesting that low iron stores per se are not associated with a higher risk of type 2 diabetes. While cross-talk between iron and insulin resistance is likely, the initiating factor of the vicious circle remains unclear (34). Cross-sectional studies showed that ferritin was correlated with 2-h glucose concentration and inversely correlated with insulin sensitivity in individuals without type 2 diabetes (8), as well as inversely with adiponectin (35,36). A recent study showed that ferritin and transferrin were prospectively associated with indices of hepatic, muscular, and adipocyte insulin resistance (37). Some experimental studies report upregulation of transferrin expression by insulin in human hepatocytes (38,39), whereas others suggest an antagonist effect of transferrin on insulin action, leading to insulin resistance (40). We suggest that the association of both ferritin and transferrin with incident type 2 diabetes could be explained, at least in part, by insulin resistance. This is supported by the fact that in this study the strength of the associations of ferritin and transferrin with type 2 diabetes was most strongly attenuated after adjustment for BMI and ALT, which are both associated with insulin resistance (41,42).
Taken together, these observed associations of TSAT and transferrin with type 2 diabetes do not support the clear role of iron in the pathogenesis of type 2 diabetes that might have been suggested by the association of ferritin. Case series in the 20th century reported a relatively high prevalence of diabetes among patients with HHC, which formed an important basis for the hypothesized role of iron in the pathogenesis of type 2 diabetes. However, the Hemochromatosis and Iron Overload Screening Study found the sex- and age-adjusted prevalence of self-reported diabetes similar in C282Y homozygotes and in participants without HFE C282Y and H63D mutations (43–46). Also, genetic studies to date show that C282Y is not associated with type 2 diabetes, whereas H63D is modestly associated (47,48). HHC was historically defined in the 19th century as the co-occurrence of cirrhosis, diabetes, and skin pigmentation, and this triad became the sine qua non of HHC until the end of the 20th century. Because diabetes was part of the triad used to define HHC, clinicians would look for type 2 diabetes in people they suspected of having HHC. This creates an ascertainment bias, which is less likely to occur now that genetic testing is the gold standard for the diagnosis of HHC. An alternative explanation for the associations observed in this study is that iron overload disorders caused by different mechanisms show different associations with type 2 diabetes, but that these differences may not be captured by the use of biomarkers. However, the use of more invasive measures of iron stores necessary to distinguish these disorders is unlikely to be feasible on a large scale.
This is, to our knowledge, the first prospective study to comprehensively report the association of four commonly used clinical measures of iron stores with type 2 diabetes. It is limited because we had a single measure of TSAT for each individual and because most samples were collected during a nonfasting state, which may have affected the dichotomous categorization of TSAT. However, this applied to all participants irrespective of their diabetes status, and the consequence would be nondifferential error, which would underestimate the strength of the association between TSAT and type 2 diabetes. This could contribute to the lack of observed association in men but does not explain the association in women. Also, we were unable to exclude participants with clinically diagnosed HHC. However, although HFE mutations are common, the clinical penetrance of the disease is extremely low (49); therefore, this is unlikely to have substantially affected our results. As with all observational studies, we cannot exclude reverse causality or residual confounding as potential explanations for our findings. However, there was no relationship between the iron biomarkers and HbA1c at baseline in the subcohort, and sensitivity analyses excluding individuals who developed diabetes within the first 2 years of follow-up did not change the results. These observations lessen the likelihood of reverse causality.
In conclusion, the observed pattern of association of these biomarkers of iron metabolism with type 2 diabetes suggests a more complex relationship than simply high iron stores being a risk factor for type 2 diabetes. It remains to be clarified whether the associations of higher ferritin and transferrin with type 2 diabetes are due to a causal role of iron in the pathogenesis of type 2 diabetes, or whether it simply reflects the underlying progression of insulin resistance. The genetics of iron metabolism in general and of different disorders of iron metabolism in particular, based on their mechanisms, may be useful in addressing these questions, which are difficult to answer using traditional observational designs.
Article Information
Acknowledgments. The authors thank all EPIC participants and staff for their contribution to the study. The authors thank Nicola Kerrison (MRC Epidemiology Unit, University of Cambridge, Cambridge, U.K.) for managing the data for the InterAct Project. The authors thank Dr. Felix Day (MRC Epidemiology Unit, University of Cambridge, Cambridge, U.K.) for assistance with the figures. The authors also particularly thank staff from the Laboratory, Field Epidemiology and Data Teams of the MRC Epidemiology Unit in Cambridge, U.K., for carrying out sample preparation, providing DNA and DNA quality control, genotyping, and data-handling work. The authors specifically thank S. Dawson and V. Kaimakis for coordinating sample provision for biomarker measurements, and M. Sims for writing the technical laboratory specification for the intermediate pathway biomarker measurements and for overseeing the laboratory work. The authors thank the SHL-Groep, Etten-Leur, Netherlands, where the biomarkers were measured.
Funding. Funding for the InterAct Project was provided by the EU FP6 Programme (grant LSHM_CT_2006_037197). Biomarker measurements in the EPIC-InterAct subcohort were partially funded by a grant from the U.K. Medical Research Council and the British Heart Foundation (EPIC-Heart: G0800270). C.P. is funded by the Wellcome Trust (grant 097451/Z/11/Z). P.W.F. has received funding from Swedish Research Council, Swedish Diabetes Association, and Swedish Heart-Lung Foundation. V.K. and T.K. have received funding from German Cancer Aid, German Cancer Research Center (DKFZ) and German Federal Ministry of Education and Research (BMBF). P.J. has received funding from The Health Research Funds (grant RD12/0036/0018) and AGAUR, Generalitat de Catalunya (exp. 2014 SGR 726). T.J.K. has received funding from Cancer Research UK. P.M.N. has received funding from Swedish Research Council. K.O. has received funding from Danish Cancer Society. J.R.Q. has received funding from Asturias Regional Government. O.R. has received funding from the Västerboten County Council. I.S., A.M.W.S., D.L.v.d.A, and Y.T.v.d.S. have received funding from Dutch Ministry of Public Health, Welfare and Sports (VWS), Netherlands Cancer Registry (NKR), LK Research Funds, Dutch Prevention Funds, Dutch ZON (Zorg Onderzoek Nederland), World Cancer Research Fund (WCRF), and Statistics Netherlands. Verification of the Dutch diabetes cases was additionally funded by NL Agency (grant IGE05012) and an Incentive Grant from the Board of the UMC Utrecht to Y.T.v.d.S. A.T. has received funding from Danish Cancer Society; R.T. from AIRE-ONLUS Ragusa and Sicilian Regional Government; and E.R. from Imperial College Biomedical Research Centre.
Duality of Interest. P.W.F. has received funding from Novo Nordisk. No other potential conflicts of interest relevant to this article were reported.
Author Contributions. C.P. analyzed the data and drafted the manuscript. C.P., K.M., M.B.S., R.A.S., A.R., A.S.B., E.D.A., J.D., L.A., A.B., H.B., F.C.-C., A.J.C., C.C.D., G.F., P.W.F., D.G., S.G., M.J.G., G.G., P.J., V.K., T.J.K., T.K., A.M., P.M.N., A.O., K.O., D.P., J.R.Q., O.R., C.S., E.S.-C., N.S., I.S., A.M.W.S., A.T., R.T., D.L.v.d.A, Y.T.v.d.S., E.J.M.F., N.G.F., S.J.S., E.R., C.L., and N.J.W. conceived and designed the study, interpreted data, and revised the article. N.J.W. is the guarantor of this work and, as such, had full access to all the data in the study and takes responsibility for the integrity of the data and the accuracy of the data analysis.